
Introduction to Data Science
What is Data Science?
Data science is the field of study that combines skills like domain expertise, programming, and knowledge of mathematics and statistics to extract meaningful insights from structured and unstructured data. Data science practitioners apply techniques that include data extraction, data analysis, data mining, and data retrieval, to produce informative results and to produce Artificial Intelligence (AI) systems to perform tasks that ordinarily require human intelligence.
With the advent of more and more information, it is becoming difficult to find the accurate form of data that is required to make business decisions. Nowadays, most of the data is unstructured, has no easily identifiable structure, and can not be used by a computer program easily and one could find a lot of junk data when they extract information. Here is where Data Science has begun to imply its significance.
Importance of Data Science
The reasons focus on the increasing importance and demand for Data Science. From the past few years, Data Science has covered a long way and therefore it becomes an important aspect of understanding the working of various industries. Below are some reasons which prove that data science will always play a significant part in the economy of the global world.
- With the assistance of Data Science, the organizations will have the option to perceive their customer in a more improved and upgraded way. Customers are the establishment of any product and play a fundamental role in their prosperity and disappointment. Data Science empowers organizations to interface with their clients in an adjusted way and this manner affirms the better quality and intensity of the product.
- Data Science allows products to recount their story capably and engagingly. This is one reason which makes it popular. At the point when products and organizations utilize this information comprehensively, they can impart their story to their viewers and consequently make better product associations.
- One of the significant highlights of Data Science is that its outcomes can be applied to a wide range of enterprises, for example, travel, medical services, and education. With the assistance of Data Science, businesses can analyze their difficulties effectively and can likewise address them successfully. Enrolling in a Data Science Courses in Erode helps learners understand how these applications work across different sectors and develop the skills needed to solve real-world business challenges.
- Presently, Data Science is accessible in practically all the fields and there is a tremendous measure of data present in the world today and if it is utilized appropriately it can lead the product to achievement or failure. If information is utilized effectively it will hold the significance of achieving goals for the product in the future.
- Large Data is continuously arising and developing. Utilizing various tools that are developed regularly, huge Data causes the association to determine complex issues identified with IT, human resources, and asset the management proficiently and effectively.
- Data science is gaining popularity in every industry and hence assuming a huge part in the working and development of any product. Therefore, the necessity of the data scientists is also increased as they need to play out a significant undertaking of handling data and delivering solutions for specific problems.
- Data science also impacted retail ventures. With the help of data analytics, it is feasible for the merchants to associate with their customers
- Data Science helps Institutions to build this connection with the clients. With the help of data science, Companies and their products will be able to create a better and In-Depth understanding of how customers can efficiently utilize their products. Data Science Course in Chennai at FITA Academy aids you to comprehend the complete concepts of the Data Science Course from its fundamentals under the training of real-time Data Science professionals with certification.
Importance Of Data Science in Businesses
The use of data analytics in business is something that companies are looking forward to growing and competing. Unstructured or large data is sometimes complex and difficult to understand, but the businesses that implement systems and strategies to collect, analyze, and use data, experience quantifiable benefits in numerous areas of their operations.
The use of data is an old concept in business. Although ‘Big Data’ has become a widely adopted phrase to refer to large datasets that a company collects, marketers and product developers have been using fixed data sets for decades.
When you look at yearly trends to forecast staffing or analyze sales and leads to help determine market wants and needs, you’re putting your data to use.Data Analytics is the way to analyze and use that data to gain insights and can help make better business decisions and increase the efficiency of market research. Data can be taken from sources such as eCommerce sites, social media, and surveys that are gathered from offline and mixed services like CRMs, spreadsheets, customer feedback, focus group, and in-store customer interactions.
The majority of the businesses in a study agreed that failing to use large unstructured data could lead to irrelevance and loss of competitiveness. The same study described the importance to utilize and transform data and emerging technologies in digital transformation. Modern businesses must embrace newer technologies that are fulfilled by data science so that they can communicate with and understand their customers. Digital transformation also relates to how efficiently businesses are run, and how data is collected. Increasing automated data collection and analytics is necessary for a company to transform.
The concepts of Big Data Analytics, collection, and digital transformation, are linked. However, the most important question is the benefits that they provide for your business.
- Data can help you to communicate with your customers in a way that is appropriate and effective. For example, maintaining a detailed account and purchase history can help you to better serve a customer and its needs.
- You can enhance and improve your products, or introduce new products by collecting and using pre-recorded data. If you collect data in an organized way that tells you how your products are used and perceived by your market, you can record the information and implement the learnings in future designs.
- Operational efficiency can be transformed with big data. Data Analytics can help to improve manufacturing, distribution, management, staffing, structuring, and many other fields. According to a survey, widespread adoption and implementation of Big Data Analytics could increase the GDP of manufacturers and retailers.
Evolution of Data Science
Each individual who knows about Data Science in its wide significance knows that the order took a lot of fundamental principles from mathematics, or, being more specific, from estimation theory. It consequently was an issue of time when the paper calculations were to be replaced with sophisticated computers, which intellectual facilities surpass even the best brains we can prepare.
However, the belief that computers can perform everything by themselves simply doesn’t go parallel with reality! With every year the demand for highly qualified specialists in data science grows consistently, while more and more companies are ready to hire even the inexperienced beginners that grow after tutored by the efforts of the employer themselves.
Why so? Despite the digital brains calculating abilities, they still lose out to data scientists – even with the most unpracticed ones – because the practice consists of something more than simple data input/output. It is creativity and an unconventional or exceptional approach to the problem that makes so much difference between a person and a computer when it comes to Machine Learning, data engineering, or augmented reality.
Data Science Process
The Data Science Process is a swift and continual Data Science approach that aids in rendering predictive analytics and applying intelligent business solutions effectively in an organization. A Data Science Process supports team collaboration and learning by advising how the team works best together. Below are a detailed description of the Data Science Process and the key components that are involved in it.
- Data Acquisition
- Data Pre-Processing
- Model Building
- Pattern Evaluation
- Knowledge Representation
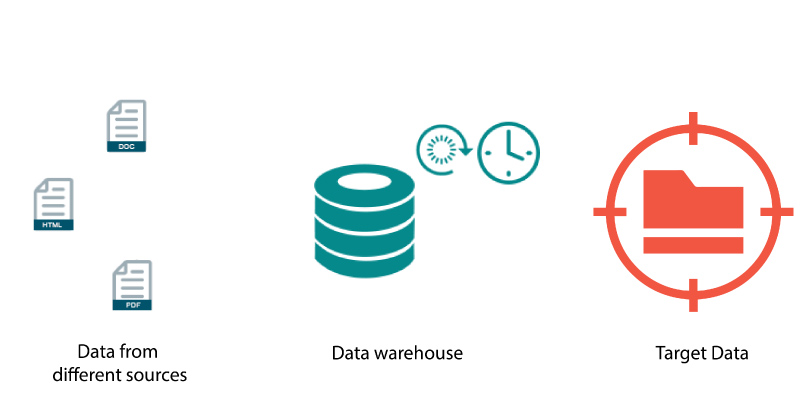
Data Acquisition
As we all knew that Data comes from different resources, and also it can come in multiple formats. So, the first step in the Data Science process should be that we should integrate the data from different and multiple locations. In addition to this, the data that has been integrated should be moved further to a specific section for implementing our Data Science tasks.
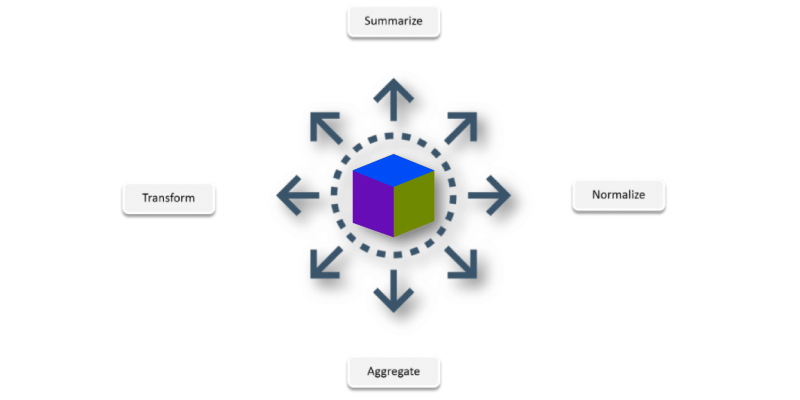
Data Pre-Processing
Once, if you are done with the Data Acquisition process, it is now the time to proceed with the pre-processing. Generally, the raw data which we gather can not be applied directly for the Data Science tasks. The gathered data should be processed using the process like aggregation and normalization.
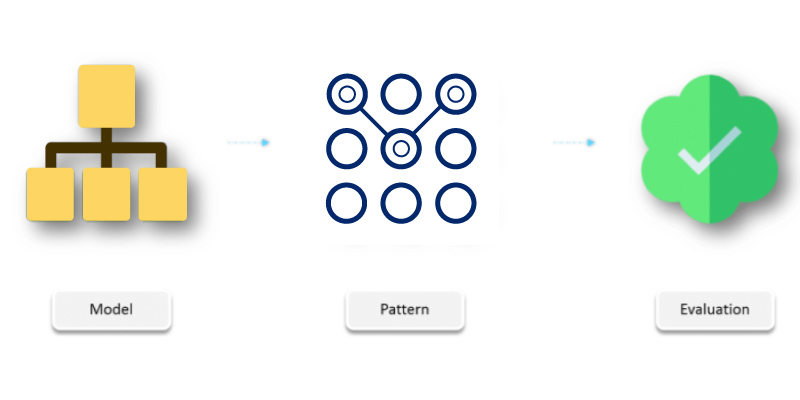
Model Building
Upon completing the pre-processing, now it is the time for the most major step that should be taken in the Data Science cycle i.e Model Building. Over here, you can apply various scientific algorithms like Random Forest, K-Clustering, and Linear Regression to find out interesting insights.

Pattern Evaluation
When you have completed the building model on top of your data, you can test the validity of all these patterns, which means in this stage you can verify whether the information obtained is useful, correct, and new. Over here you have to make a note that the gathered information should fulfill all three conditions in order to consider the collected information as valid one.
Knowledge Representation
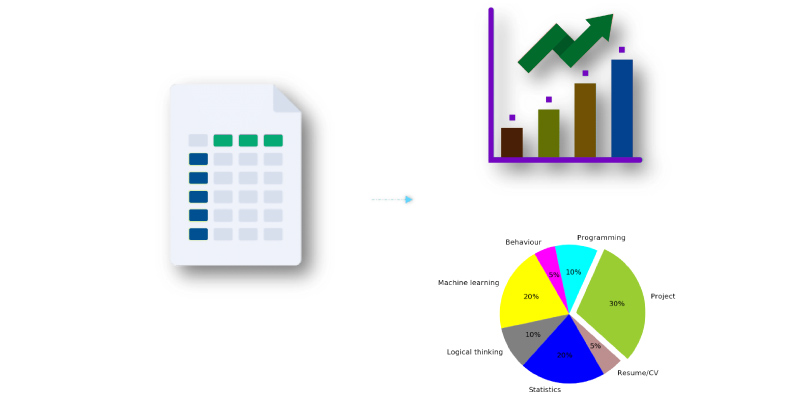
If the information collected is validated then it is time to represent that information with a simple aesthetic graph.
Top Data Science Programming Languages
The procedures of data science consist of data munging, data mining, and delivering actionable insights. Generally, a common toolset to get all or part of these includes Python, R, Tableau, SQL, Java, Matlab, SAS, Scala, C,C++ and Julia. In this Data Science Tutorial we are going to see some of the top languages that are used by a Data Scientist.
Python
Python is an object-oriented programming language that helps in rapid application development, It has a huge bid in the Rapid Application Development field due to its dynamic binding and dynamic typing options. Python can connect with database systems and can read and modify files. It supports rapid prototyping and production completed software development.
R
‘R’ is great for Inspecting the data and running algorithms on different parameter settings. This makes R a great tool for prototyping data science, it identifies the key feature set as well as a great machine learning algorithm with parameter setting. ‘R’ is also undefeatable with its visualization packages and can be used to turn a repeatable data mining piece into a gleaming report.
Tableau
Tableau is one of the best commercial software available for visually exploring your data sets. Tableau works exceptionally in performing interactive visualization reports or data stories.
SQL
Besides Python, R, Tableau, there's one more data science tool that data scientists prefer, SQL is the language of English in the world of data munging, or at least have been so for a prolonged period. It performs great in integrating different data sources, and as a handy tool for data exploration and data debugging.
Java
Though Java is one of the oldest programming languages, it has been used widely across a range of business enterprises for secure development. To meet the booming needs of the Data Science domain, Java has significantly contributed to the domain of Data Science with a broad range of tools such as Spark, Hadoop, Hive, and Scala. Furthermore, Java Virtual Machines are the most preferred choice among the developers to write the codes for Distributed Systems, Machine Learning, and Data Analysis in an enterprise environment.
MATLAB
MATLAB is predominantly used in the Mathematical Computing Environment to perform advanced numerical computations and it comes with different tools that support you in carrying out the operations like function and data plotting, matrix manipulation, and a lot more. Having a demonstrable knowledge of MATLAB, enables you to handle the trickiest statistical and mathematical problems at ease. It is primarily used in academia for teaching numerical analysis and linear algebra.
SAS
Just like R, SAS is one of the best Statistical Analysis tools that are built specifically for the purpose of predictive analysis, advanced analysis, and business intelligence. The SAS permits the users to alter, mine, and handle data from different sources to perform advanced statistical analysis. The Software Environment is broken into different sets of tools that provides the above-mentioned functionality. Also, it offers other facilities such as quality control, data management, code editor, grid computing manager, and project manager.
Scala
Scala is the high-level programming language that can run on the JVM - Java Virtual Machine and it can make the work process an easier one. The Scala shall be used effectively with the Sparkfor handling the huge amount of siloed data. The underlying concurrency makes Scala the best option to build a high-performance Data Science framework like Hadoop.
C, C++
The C C++ has occupied itself an important position in the Data Scientist toolkit. Above all the recent Data Science Frameworks, this is comparatively one of the low-level programming languages that are actually responsible for executing high-level codes that are fed on to the framework. Though this language is simple, it is one of the extremely robust and powerful programming languages out there.Despite being a low-level language, C C++ allows the Data Scientists to have a good requisition over their applications.
Julia
This is a dynamically-typed multi-purpose programming language that is the most suitable option for numeric and computational analysis. Though it is a high-level language, Julia can also be used as low-level programming when required. This language is basically used for tasks such as Risk Analysis, Time-Series Analysis, and Even Space mission planning.
Reasons to Learn Data Science
Today, Data Science occupies a predominant role in the epoch of Cloud-based businesses. Regardless of the tasks in a work environment be it a management task or data utilization, you have an endless scope as the modern applications of this domain are developing robustly. When you become well versed with Data Science, you will be able to contribute more to the decision-making process of a business with the help of a proper predictive analysis. Currently, there is a soaring need for skilled Data Scientists across the globe. Apart from this, Data Scientists are immensely demanded in all the sectors of businesses - primary, secondary, tertiary, and service sectors as well. The major role of the Data Scientists is to collate the past and present data to forecast future performance and potential.
The vital reason behind the tremendous growth of Data Science is that in the present days, a majority of the work is related to identifying the origin of any issue and it has been made easier with the significant growth in the Data Science field. Generally, Data Scientists would take the raw data as input and convert it as an easy solution to solve the business queries. For instance, Data Science is used in the Aviation Industry to foresee the shortcomings that can possibly take place in their flying services and to make the flying experience a seamless one for their customers.Some of the Pre-planned decisions that can be made using Data Science in the Aviation industry are as follows:
The creation of Personalized Promotional offers to drive a higher amount of traffic to the booking portals on the basis of the individual booking styles.
You can also make Flight scheduling & Root Planing which means whether a flight shall be connected directly or not.
Keeping these facts aside, it is even more simple to spot the growing importance of Data Science currently with seamless online surfing has turned out to be. The Data Algorithms occupy a major role in aiding you with the quality customized deals, and delivery times, even if it is for purchasing a bag for your personal use.
Below in this Data Science Tutorial for beginners we have outlined to you the process that is involved in creating a seamless online experience for the consumers via data repositories:
- Initially, Data Scientists should fetch questions to understand any outstanding issues in a cohesive and easier manner.
- Then comes the gathering of data both from the Public and Enterprises.
- After this, the Data Scientist processes the data and enables it with a predefined format that is appropriate for efficient analysis.
- Later, they fetch these data into the ML algorithm or to a statistical model that functions with the Analytics Systems.
- Finally, they collate the outcome and share them with the respective department.
To comprehend the applications of Data Science even better, let us take a closer look at the essential aspects of this field:
- Study the Concepts - The initial steps in the projects that are associated with Data Science is the method of concept study. The prime goal of this stage is to have an extensive understanding of the primary business model to get through the underlying issues smoothly. For Analysis of any kind, one must be aware of the terminologies that are used in it and the concepts that are correlated with it. This attribute immensely aids you in identifying the mandatory data for other analysis
- Data Preparation - It is obvious that you can use raw data to arrive at a conclusion. In the entire lifecycle of Data Science, the most crucial stage is Data Preparation. Once you have prepared the Data, there are other important steps such as Data Transformation, Data Reduction, Data Integration, and Data Cleaning which have to be performed.
- Model Planning - The next major step is model planning. A selection of a model relies on the type and nature of a problem.
- Model Building - With the help of efficient Analytical tools and techniques, a Data Scientist can build models where they can manipulate the Data easily. It supports identifying useful information.
- Communication & Operational Tasks - This is the final step that helps in finding and communicating it with the stakeholders. The Data Scientists must be profound in communicating the output to the business-based audiences. When the results are accepted, then the practical approach of analysis is initiated.
Is Data Science tedious to learn?
Currently, Data Science is one of the exciting fields out there with a broader career scope. It is visible that there is a significant spike in the IT domain to learn Data Science. Though there is an increasing spike for this field one can not opt for it blindly without knowing the adversity that is lying ahead for them. There are some intricacies in mastering the Data Science concepts when you try to comprehend all of it by yourselves. The intricacies include
- Voluminous Data
- Technical expertise
- Domain Knowledge
- Difficult Problems
Voluminous Data
It is a known fact that the Data is the lifeline of the Business as well as for the Data Scientist. It is the Data that aids businesses to operate efficiently in the current world. With the raging expansion of the Data, it has turned out to be a challenge for the Data Scientist who constantly works on deriving insightful information to make informed business decisions. Over here the Data Scientists have the trouble of dealing with a mammoth of Data i.e can be in any format ( Structured, Semi-Structured, and Unstructured) which add on to the difficulties that are endured by the Data Scientists. To handle these huge amounts of Data, Data Scientists must be aware of the tools and how to analyze and categorize them efficiently
Technical Expertise
Data Science is a field that descents from different disciplines. The disciplines include Statistics, Mathematics, Programming, Science, and other key fields to make up Data Science. Apart from this, there are also other sub-constituents of this field that a Data Scientist should master. At the initial stages, it may take some time, but with years of experience and knowledge gained it would be easier for you to understand the concepts and apply the techniques.
To become a well-equipped Data Scientist, you should have proficient knowledge of Statistics and this is the main reason why you can often find most Data Scientists hold a Ph.D. degree in Statistics, Finance, Qualitative Analysis. Additionally, you are required to have the knowledge of any of the programming languages to have a good command of the statistical models and findings. To conclude, to master Data Science you should first comprehend its underlying disciplines, and enrolling in a Data Science Course in Trichy can help you gain the necessary skills and expertise to excel in this field.
Domain Knowledge
First, you should have a clear idea that Data Science is not only about solving an issue by finding an alternative solution through online resources. Though these skills are vital for building the fundamentals, it is the knowledge of the domain that completes the picture of Data Science.
Usually, domain knowledge is gained through experience. And Data Science primarily needs domain knowledge to find useful variables for developing the models in the substance of the business problems and fine-tune models for eliminating the bias that is found through the understanding of domain knowledge.
Numerous domains utilize Data Science and the fields include Finance, Banking, Health, Sales, Manufacturing, and Pharmaceuticals. Generally, any business needs Data to make a planned analysis and decision. And usually, the customers can be end-users of any business domain, and therefore it is mandatory to have a wider knowledge of the customer domain to obtain better results.
Difficult Problems
A Data Scientist should have the knack to solve problems. The problems primarily focus on building models that can handle some of the toughest business problems. Generally, the Data Scientist needs the characteristics of problem-solving and high knowledge of the mathematical aptitude. A Data Scientist should identify the patterns within a data for generating the insights to derive at the conclusion from the given data. Furthermore, a Data Scientist should possess a lot more reasonable thinking and pressure handling tactics to meet up with the problem. Also, you must note here that the problems are found massively and it arises from different directions.
And so, to make the companies build Data Science solutions, you should understand the very basis of a problem and imply an analytical approach to resolve it.
To conclude, Data Science is a vast field with a steep learning curve. You can overcome all these intricacies when you step into a professional organization that upskills your knowledge of the Data Science concepts clearly from its fundamentals. Data Science Online Course at FITA Academy provides a holistic training of the Data Science concepts and techniques from scratch under the mentorship of professional Data Scientists with certification.
Top Data Science Prerequisites
Data Science is a vast sector and it is not just a standalone discipline but a field that is inclusive of numerous other disciplines. Often there is bewilderment from where to begin the learning and the prerequisites to master the Data Science concepts. Here in this Data Science Tutorial module , we will guide you through the important prerequisites that should be fulfilled by Data Scientists. In this module, we have split into two main topics and they are Technical Prerequisite and Non- Technical Prerequisites.
Firstly let us move on with the Technical Prerequisites
Technical Prerequisites
Statistics
A fundamental understanding of Statistics is needed such as Mean, Median, and Standard Deviation. Apart from this, there are other advanced Statistical topics such as Descriptive and Inferential Statistics.
Descriptive Statistics
Descriptive Statistics is all about defining the data. This deals with a quantitative summarization of the data via numerical representations or graphs. Few of the concepts that are needed for apprehending the Descriptive Statistics are
- Normal Distribution
- Kurtosis
- Central Tendency
- Variability
Normal Distribution
The Normal Distribution is also called Gaussian Distribution. It is the interpretation of an enormous sample of Data in the plot. It is the circulation of the values of the variables using the probability function. In the normal distribution, you will have a “symmetric bell-shaped curve”, and here the observations clusters at the central peak where they interpret the “mean” or the “average”. When the values tend to move further away from your mean, it taps off equally on both the left and right direction. To perform the inferential statistics, it is required that the data should be distributed normally.
Skewness and Kurtosis
The Skewness calculates the shortage of symmetry in the Data sample. The Symmetrical data helps in displaying the form of Normal distribution and where the trail is distributed evenly from the left to the right side of a mean. Generally, for the normally distributed sample data, the Skewness is Zero. You will have a “positive skew “ when the data is being aggregated from the left side, if the data is stacked from the right side then you will have a “negative skew”.
And now the Kurtosis is the measurement of the "tailedness" of a probability distribution. This measures the data whether it is lightly tailed or heavily-tailed that is related to the central location of a distribution. If there is a light kurtosis then the data-sets consist of light tails and when there is high kurtosis, the data-sets consist of heavy tails.
Central Tendency
The measure of Central Tendency or a Central Tendency finds the central point that is within the given sample data. The Central Tendency consists of three main parts and they are the Mode, Mean, and Median. Similar to the Normal Distribution that is mentioned above, the mean occurs at a central point of sample data. It is known as the Arithmetic Average of all the other data values. Or it is the Sum of all data values that are divided by several data values.
The Median is the midpoint of the data that is placed in ascending order. Over here, you have to note that is easier for you to find the mid-value in the series of an odd number, but when it comes to series of even number it is little tedious and over here you should sum the two middle-most values and take the average of those two scores as the output value of the median.
Example for Odd series
1,3,5,7,9,11,13
- Data Science Notes for Beginners - In the above series, 7 is the mid value.
Example for Even Series
      2,4,6,8,10,12,14,16

      x = 8+10/8
      x= 18/8
      x= 2.5
Lastly, the final measure of the Central Tendency is Mode. The mode is a commonly occurred value in the given sample data.
Example for Mode
2,3,5,7,5,1,5,34,5,6,5,8,9,0,89,5
- Data Science Notes for Beginners - In the above series, 5 is the commonly occurred value in the above-given series.
Variability
It calculates how far is a data point from a central mean of the distribution. It also aids in measuring the magnitude of the distance between the data-points. The measure of variability includes variance, standard deviation, range, and interquartile range.
- A range is a measurement of the differences between the largest to the smallest value of your sample data.
- The Variance is the variation of the Squared Values from the Standard Deviation and the Mean is the Square root of the variance.
- The Interquartile range is the contrast between the upper and lower quartile. A lower quartile is the first quartile that depicts 25% of the Data, whereas the upper quartile is the 3rd quartile that depicts 75% of data.
Inferential Statistics
Descriptive Statistics is about defining the data. Whereas Inferential Statistics is about concluding or inferring from the data. Generally, inferential statistics is all about making an inference about the population via a smaller sample. For instance, consider counting the number of people who are vaccinated with Polio in India. You can do this in two different ways and they are
- The first step is you can go and ask every person in the country whether they have been vaccinated or not.
- The second step is to collect a sample of the people from your city and use the local population for calculating the average number of vaccinated people in your country.
Over here, the first method is not viable to ask all the individual citizens of the country. However, the second method can be executed but upon one condition that is the implementation of some statistical measures will aid you to draw inferences or conclusions from the small sample and you can use it to apprehend the patterns and trends of the larger set of people. Here in this section, we will look in detail and drive you deep into statistical tools that are used in performing the above-mentioned tasks.
- Hypothesis Testing
- Central Limit Theorem
- Quantitative Data Analysis
- Anova
Hypothesis Testing
This is the method of testing that is done based on assumptions. Hypothesis Testing is used in inferring the results of a hypothesis that is performed on a sample group or from the larger group of a population. A hypothesis that we are required to test is known as the “Null Hypothesis”. And the Hypothesis that is against which we should test is called the “Alternate Hypothesis”.
A Null Hypothesis is generally the ideal case that we should test. For instance, if you are surveying two different groups who do exercise and who don't exercise. Now, let us presume that the mean of diabetes patients is equal in the exercising group as well as in the non-exercising group. Over here, It is our Null Hypothesis that we must test and later decide if we should repeal the hypothesis or not.
Contrarily, the alternate hypothesis shall be the number of diabetics patients that is present in the non-exercising group and it is higher than the people present in the exercising group. Henceforth, the mean of the diabetics patient in the non-exercising group is way higher than the people in the exercising group. On the basis of the data provided, it is evident that you are able to test 2 hypotheses and conclude when we should reject the null hypotheses and when we should not.
A Hypothesis is tested on four different steps-
- We should explain both the alternate and a null hypothesis so that you can reject any one of them.
- Evaluating the data via an Analysis plan.
- You should compute the test statistic and be able to analyze the sample data physically.
- Lastly, you can interpret the results and reject any one of the 2 hypotheses.
Central Limit Theorem
Based on the Central Limit Theorem, the mean of a sample is similar to that of the complete population. It also indicates that a standard deviation of the sample is equal to the standard deviation of the population. Finally, with the multiplication in the sample size, the standard errors turn down to be lower and result in a normal shaped curve. It helps in identifying the mean of a population more definitely. The most important concept in the Central Limit Theorem is the "Confidence Interval" .
A confidence interval is a measure of the estimated population mean. The confidence interval confines to the mean of your sample. It is a process of constructing your interval that includes the addition of your margin error. Also, you shall calculate a margin error by magnifying the standard error of a mean with a z-score of the percentage of a confidence level. Hence, it is termed that the confidence level interprets the percentage of the interval estimates that consist of the population.
Quantitative Data Analysis
The common Quantitative Data Analysis techniques are Regression and Correlation. A Correlation is a statistical interconnection between the bivariate data and random variables. Generally, there are 3 kinds of Correlation and they are Positive, Negative, and Zero Correlation. The Positive Correlation indicates that there is a relationship between two variables and that allows you to increase or decrease together. In the Negative Correlation, the increment is one of the forms of a variable that causes the decrement in the other variable. While in the Zero correlation, you definitely don't have the relation between two variables.
Few Examples of the Correlation are
- Usually, there is a Positive Correlation between people who eat more and people who are obese.
- In the same way, there is a Negative Correlation between the people who are spending their time exercising to gain weight.
The other type of Quantitative Data Analysis is Regression. A Regression is a statistical technique that is used in assessing the relations among the variables. A Regression can be a simple or multiple regression that is based on several independent variables. Furtherly, the functions that are used are of the nonlinear nature, then, this kind of regression is also termed as the non-linear regression.
Anova
It is basically the hypothesis testing that is performed under different groups. This is used for checking when the groups have similar mean and variance. Though the test can prove to be complex owing to numerous factors, ANOVA can perform the role better with a minimal error rate. The \\ Using F-ratio can measure the ANOVA. The F-ratio is termed as a ratio of Mean Square (between groups) of Mean Square (internally in a group). The different steps that are included in calculating the ANOVA are:
Generate and Understand the 2 hypotheses i.e the alternative and null. In the Null hypothesis, you can assume that the mean of all this group is the same while the alternative hypothesis means is different.
- You can calculate the Mean Squares within the groups and between the groups.
- It calculates the F-ratio using the above-mentioned calculated values.
- Using an F-table, you can calculate the probability.
- If the calculated F-value is higher than an F-critical value, then you can reject the null hypothesis.
Machine Learning
For understanding Data Science one should be well-versed with the concepts of Machine Learning. Data scientists use Machine Learning algorithms for solving numerous problems.
Mathematical Modelling
There are two important topics of Mathematics that one should know before they plan to become a Data Scientist. When we say Mathematics it is not just the fundamentals but it also includes the advanced and complex topics in it. Below are the advanced topics that a Data Scientist should be aware of.
Linear Algebra
Linear Algebra indicates the study of Linear functions and Vectors. Linear Algebra is central to all topics of Mathematics and as well as in the Data Science field. It includes numerous topics like vector, tensor, and matrix operations for carrying out the Machine Learning Algorithms. The different Machine Learning topics such as Natural Language Processing and Computer vision hugely rely on Linear Algebra.
Currently, with the development of advanced deep learning algorithms, computers are capable of performing complex linear algebra problems. When your Mobile Phone uses facial recognition for unlocking itself it majorly depends on Linear Algebra. Linear Algebra is used in the (PCA) which is the Principal Component Analysis which is the important topic dimensionality reduction in Machine Learning. Apart from this, it is also used in conjunction with statistics via the implementation of multivariate statistics, solutions for the least-squares in the covariance, and regression matrix in the Gaussian Distribution. Hence, to become a professional Data Scientist, one should have a good hold on the fundamentals of Linear Algebra.
Calculus
It is the Mathematical Study of constant change. We should understand the calculus of how the quantities accumulate (integrate) and dissipate(derivative) over time. In Data Science, calculus is utilized in optimization techniques. Gradient descent is one such optimization technique that is used in calculus. A Gradient Descent is the assessment of change in output with the changes in the input. A Gradient Descent uses "Cost Function" that measures the goodness of the given line. For determining the gradient of this line, you can use the Partial Differential Calculus. Mostly in Data Science, they use Multivariate Calculus. Thus, to comprehend the concepts of Machine Learning principles, Data Scientists should be aware of calculus.
Computer Programming
It is preferable that if a Data Scientist possesses the knowledge of any of the programming languages. The languages include Python, R and Spark. Also, it is of more benefit when the Data Scientist has a sound knowledge of Excel.
Databases
A Data Scientist with an in-depth understanding of Databases like SQL is highly preferred to work with the Data efficiently.
Non-technical Prerequisites
- Critical Thinking - A Data Scientist should possess the attribute of critical thinking to find numerous ways to resolve a problem with utmost efficiency.
- Communication Skills - Communication skills are vital skills that should be obtained by Data Scientists. It is because a Data Scientist should be able to communicate efficiently within a team so that you can find a solution at a faster phase.
- Curiosity - For learning Data Science one should have a major attribute and that is curiosity. Only when you have curiosity will you understand a business problem easily.
Data Science Portfolio
There is a common perception among the aspirants who desire to start their career in the Data Science domain you must have inculcated all the skills that are needed to get hold of a job. And so the aspirants just fill in all the skills on their Resumes to secure the job at ease. Over here you have to understand that a Resume and a Portfolio are completely two different things. In a nutshell, a Resume is the summary of your skills, talents, experience, life, and hobbies which lastly longs for 1-2 pages. Whereas, a portfolio acts as a valid piece of evidence in authenticating the skills and knowledge you have gained. And here you should understand the “difference between the capacity to showcase your potential employer that what you are capable of performing rather than just convincing them you are capable of performing something important through words”.
All the Prospective Employers seek a candidate who has a stronghold over the specific skills mentioned and the one who can add on to the value of their business with that skill set. The major crunch here is how can you demonstrate your potential skills to your prospective employer and how to unlock career opportunities.You can easily solve this crunch easily with a "Professional Portfolio".
Now let us understand What is a Data Science Portfolio?
It is the compilation of the set of Data Science projects that you have accomplished during your Data Science learning session or the experience you have obtained from your previous organization.
A Portfolio should focus on two main goals and they are
- The Portfolio should be curated in a way that highlights your knowledge. It should be structured in the manner that it shows your stuff and knowledge explicitly to your employer.
- The Portfolio must highlight that you are one of the best people to work within a team. It means you should be a very good team player as this one of the highly demanded attributes among the Data Scientists in the industry.
First, you should be clear about what kind of job you are seeking. In case if you wish to work on (system building/ building pipelines/ engineering ) then you should focus more on the end-to-end projects. To do that you should showcase to your employer that you can:
- You can come up with innovative/ great ideas
- You are capable of accomplishing the projects that deal with the prototype work model.
- State or articulate clearly in the portfolio what have you built for the Non-Data Scientists.
In case, if you are seeking more the A/B testing job/data storytelling/ analysis/ measurement then you should show that
You can identify the new information in the given data
And you are capable of summing up in short and that you can communicate the information to different stakeholders at ease.
Communication is the most important aspect irrespective of the role you play. While preparing your portfolio you have to keep in your mind that you should present both the technical and non-technical aspects well.
The Characteristics of a Good Portfolio
It should be diverse that you should showcase a variety of projects. The variety includes
- Time-series Analysis
- Text-Based Project
- An Image project
- A visualization project
- A mapping/geo project
- Hypothesis Testing
- A/B Testing
- Regression Analysis
- SQL based projects
- Intense Data Cleaning projects ( different data sets, missing data that needs imputation)
Showcase that you can perform in a flexible way and follow the best software engineering practices.
Important Data Science Notes for Beginners:
On the endnote, there is one significant thing you should implement. Don't place everything in just one big file. Allot the functions to a separate file or split the data into different categories such as data cleansing, data modeling, and data analysis for a better understanding.
Top Data Science Algorithms
The application of Data Science for any problem needs a compilation of skills. Machine Learning is the vital skill set required to perform Data Science functions. For executing the Data Science function, you should know the different Machine Learning Algorithms that are used for solving various types of problems.
The thing to be noted here is that a single algorithm is not suitable for all kinds of use cases. You may require different algorithms to solve cases of different approaches. An algorithm can be applied based on different tasks such as prediction, clustering, and classification from the dataset under the consideration. Here in this Data Science Tutorial for beginners, we have explained the different Data Science Algorithms that can be used for various approaches:
- Linear Regression
- Decision Trees
- Logistic Regression
- KNN
- Naive Bayes
- K-Means Clustering
- Support Vector Machines
- Principal Component Analysis (PCA)
- Random Forests
- Neural Networks
Linear Regression
It is the kind of approach that is used for foreseeing the value of a dependent variable by applying the value of an independent variable. A Linear Regression model is more appropriate for detecting the value of the unceasing quantity.
A Linear Regression model interprets the correlation between the input and output variable (x and y) respectively of the dataset based on the terms of a line in the equation given below,
y = b0 + b1x
Where,
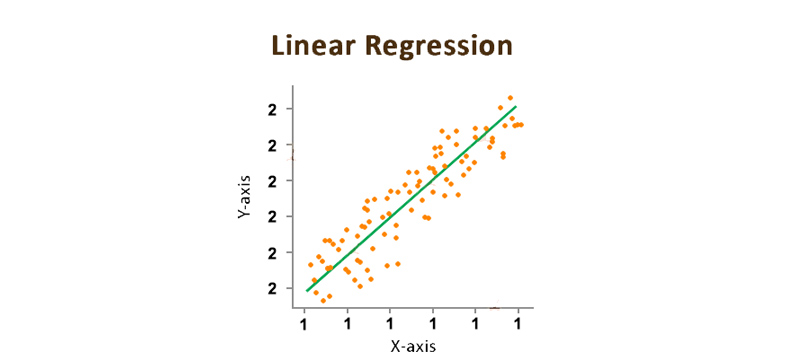
- “y” is a dependent variable whose value you should predict.
- “x” is an independent variable whose values are utilized to find the dependent variable.
- b0 & b1 are the constants i.e b0 is a Y-intercept and b1 is a slope.
This is primarily used for determining the value of b0 and b1 to find out the best fit line you shall cover and it should be nearest to most of the data points.
Decision Trees
Decision Trees aid you in resolving both the prediction and classification of the problems. It makes it simpler for understanding the data with better accuracy and predictions. Every node of a Decision tree depicts the feature of the attribute and all the links interpret the decision of all nodes and it holds the class label which is the outcome. One of the significant disadvantages of the decision tree is that it has the intricacies of overfitting. Usually, these two Data Science Algorithms are used generally for implementing Decision trees.
ID3 ( Iterative Dichotomiser 3) Algorithm
This Algorithm utilizes the information gain and the entropy as a decision metric.
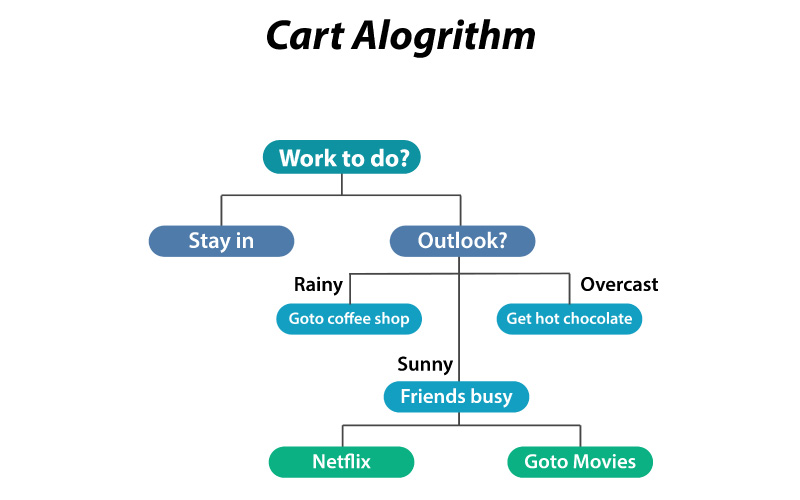
Classification and Regression Tree (CART) Algorithm
It uses the Algorithm the Gini index as a decision metric.The flow chart that is given below helps you to understand the Cart Algorithm better.
CART Algorithm
Logistic Regression
A Logistic Regression is the straight opposite of Linear Regression. Usually, Linear Regression is used for representing the values of the continuous variables whereas Logistic Regression is used for representing the values of the discrete values. A Logistic Regression is used for finding the common application in resolving the binary classification of problems, i.e where you have only two possibilities of the event, i.e whether the event will take place or it will not (0 or 1)
In the Logistic Regression, you can convert the predicted values to values that lay in the range from 0 to 1 by using the Non-linear transform function and that is called the logistic function. A Logistic function results in the S-shaped curve, and therefore it is called the sigmoid function which is given by the equation,
?(x) = 1/1+e^-x
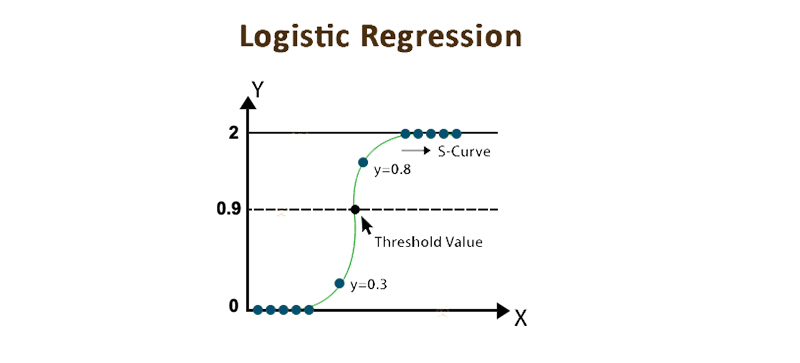
Given below is the equation of the Logistic Regression,
P(x) = e^(b0+b1x)/1 + e^(b0+b1x)
Where the b0 & b1 are the coefficients and the Logistic Regression that aims to determine the value of these coefficients.
KNN
K-Nearest Neighbours is also known as KNN. The Data Science Algorithms implies both regression and classification problems. A KNN algorithm is termed as the complete dataset as a training dataset. While you are done with training the model using a KNN algorithm, you should try to envision the outcome of the new data point. A KNN Algorithm examines the complete data set to find the "k" which are nearer neighbors or the more similar ones to the data point. Later, it anticipates the outcomes based on the k instances. To identify the nearest neighbors of the Data instance, you can use the different distance measures such as “Hamming Distance”and “Euclidean Distance”. For a better understanding, go through the below example,
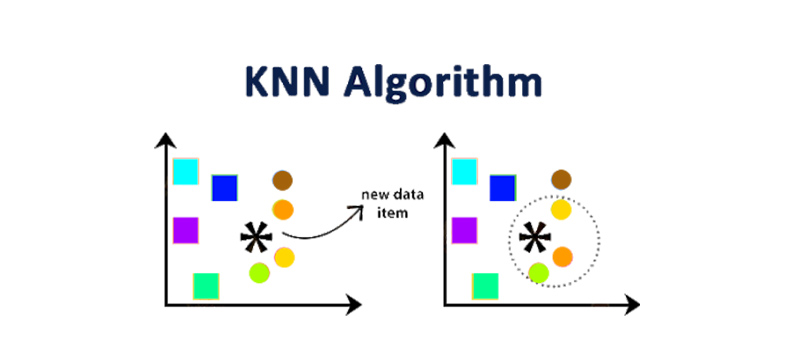
In the above diagram, we have presented you with two classes and they are "A" and "B" by the square and circle respectively. Let us take the value of k is 3 on assumption. Now, you should find the first 3 data points that are nearer to a new data item and encircle them with the dotted circle. Here are the 3 closest points of a new data item that belongs to class A. So, you can tell that a new data point shall also belong to class A. Now you may doubt that how did we assume that the value of the k =3. Over here the selection of a value k is a risky task. Usually, you should take the value of the k that is neither too high or that is neither too small. To make it even more simple for you, take the value of k=√n and where n = the total number of data points.
Naive Bayes
A Naive Bayes algorithm supports you in building the predictive models. You can use the Data Science Algorithm when you need to calculate the probability of recurrence of the event in the future. To do this, you should have a prior understanding of another event that has taken place already. A Naive Bayes Algorithm works on an assumption that all the features are independent and every feature consists of an individual contribution for the final prediction. You can represent the Naive Bayes theorem using:
P(A|B) = P(B|A) P(A) / P(B)
Over here the A and B are two events.
- P(A|B) is a posterior probability. This means the probability of the A which is given that B has taken place already.
- P(B|A) It has the tendency that the probability of the B given that A has taken place already.
- P(B) is a predictor of the prior probability.
- P(A) is the class that is before the probability.
K-means Clustering
This is the kind of unsupervised Machine Learning Algorithms. The Clusters usually mean dividing the data set into groups of the same data items that are called clusters. K means clustering classifies the data items into the k groups that are similar to the data items. To measure the similarity, you can use the Euclidean distance which is
D = √(x1-x2)^2 + (y1-y2)^2
The K means clusters are an iterative type in the attribute. The fundamental steps that are applied in the below algorithm are:
- First, you should choose the value of k that is equal to the total number of clusters that are into which must categorize the data.
- Later you can elect the random center values for all of the k clusters. Begin your search to the data points that are closer to the cluster center by applying the Euclidean distance formula.
- After that, you can calculate a mean of data points that are assigned to every cluster.
- Again you can search for the data points that are closer to centers that are created recently and you can designate them to the closest clusters.
You should repeat the above-mentioned steps till there are no changes in the data points that are assigned with the k clusters.
Support Vector Machines
The Support Vector Machine or the SVM comes under the division of the Supervised Machine Learning algorithms and it helps you to find the application in both the regression and classification problems. This is commonly used for the classification of the problems and it segregates the data points by using the hyperplane. The initial step of the Data Science Algorithm includes plotting all data items as single points in the n-dimensional graph. Over here, the 'n' is the total number of values and features of all individual features that is specific to the value of coordination. You can identify the hyperplane that frees the best two classes to classify them. The closest data point separates the hyperplane that supports the vectors.
Take the below example to understand how you shall identify the right hyperplane. The fundamental concept for choosing the best hyperplane, you should choose a hyperplane that segregates the two classes well.
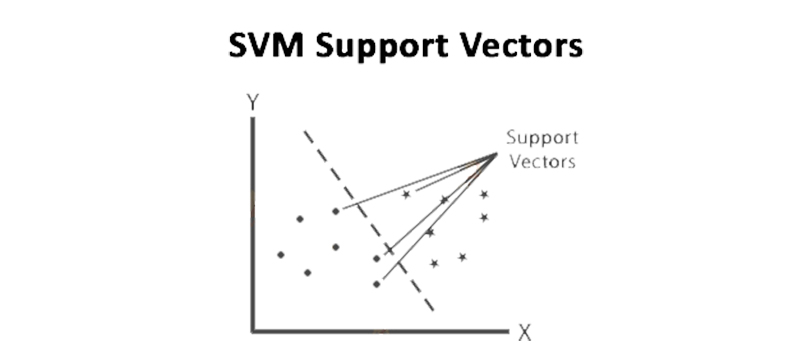
In the above case, the hyperplane B classifies the data points accurately. Hence, B is the right hyperplane.
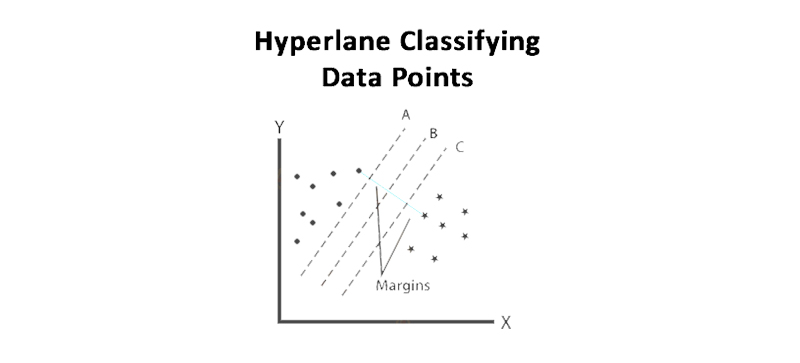
All three hyperplanes separate the 2 classes accurately. In those cases, you should choose the hyperplane with a maximum margin. As you can see on the above image, the hyperplane B has more maximum margin and hence it will be the right hyperplane.
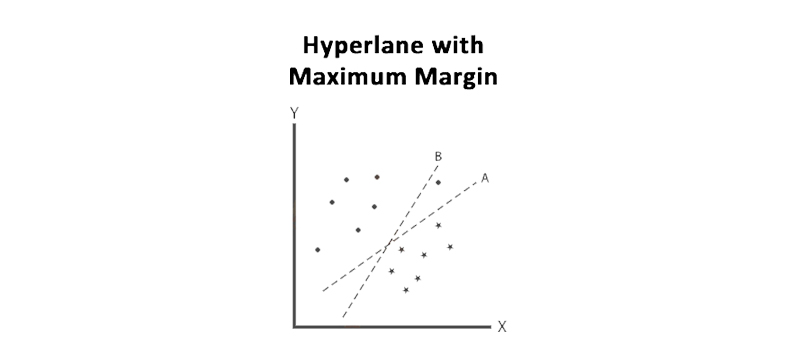
In this case, the hyperplane B has more margin but it does not classify the two classes concretely. So, A is the right hyperplane.
Principal Component Analysis (PCA)
PCA is generally the technique that is used in executing the dimensionality reduction of datasets with less effect on the variance of a dataset. It indicates removing the inessential features but in the meanwhile, you should keep the important ones too. For achieving the PCA, it transforms the variables of a dataset to a new series of variables. This new set of variables depicts the principal components. The important characters of these principal components are:
Every PCs is orthogonal which means they are at the right angle to each other.
It is created in a manner that with the rising number of components, the extent of variation it retains begins to decrease. It means the 1st principal component maintains the variation of the maximum extent when correlated with the original variables.
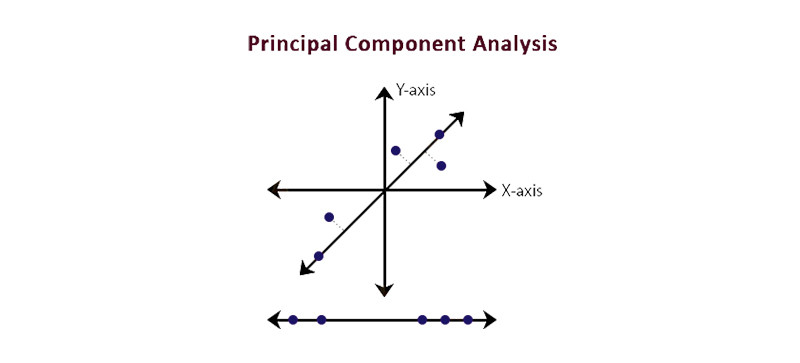
PCA is generally used in summarizing the data. When you deal with the dataset there may be few features that are associated with each other. Hence, the PCA permits you to reduce the features and make predictions with a lesser number of features that do not compromise with accuracy. For instance, consider the below diagram in which we have reduced the 3D space to the 2D space.
Random Forests
This algorithm can run-over the overfitting problem of the decision trees and it supports clarifying the regression and classification problems. The Random Forest algorithm primarily functions on the Ensemble Learning principle. An Ensemble Learning approach is affirmed to be a huge figure of the weak learners to work together to provide a prediction that has the highest accuracy in it. Generally, the function of the Random Forest is more similar. This takes the prediction of a large total of the individual decision trees to provide the outcome. This calculates a large number of votes and it becomes the anticipation of a model. The illustration that is given below help you to understand it easily,
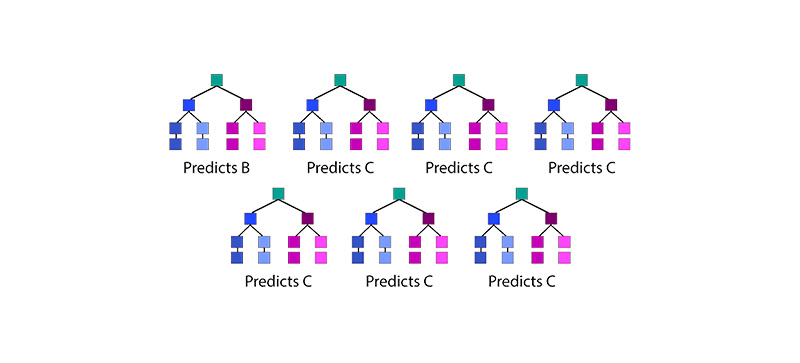
From the above-given image, it is clear that two classes are labeled as B and C. In this random forest, it consists of 7 decision trees, out of which 3 are voted for class B & 4 votes for the class C. As Class C has obtained the maximum vote this is the model's prediction of class C.
Neural Networks
A Neural Network is also considered as the Artificial Neural Network. Let's take the below instance to apprehend this example:
Determining the digits that are written in the above image is the easiest task for all of us. It is because there are numerous neurons in the human brain that are structured in a manner to perform the complex calculations to find any visual easily at any time. Whereas in Machines, it is a tedious task to execute.

Neural Networks solve the problem by instructing and practicing the machines with numerous examples. By doing this, a machine can immediately learn from the given data to recognize different digits. Hence, we can confidently say that Neural Networks are Data Science algorithms that primarily work to make the machine find the different patterns in a way that is similar to the human brain.
Leading Data Science Projects
Data Science is the approach that aids in resolving the problems of real-life by using the input that is derived from the relevant data information. Data Science helps in identifying climate change, fraud, anticipating market sales, and even detecting the heart disease of a person. This has shot up the demand for skilled data scientists across the world.
It is because the companies are utilizing the information that is provided by the Data Scientists after a deep analysis to estimate the life of a product, its sales, future, and even try understanding the customer behavior to meet up with the long term goals and to sustain in the market as well. In the current tech-savvy world, an aspirant who seeks to begin a career in the Data Science domain and is required to have fundamental work knowledge of the Data Science projects before they step into the organizations.
And so, in this Data Science tutorial session, we have jotted down the key Data Science projects to be done by you before getting into a Workspace environment. Adding on these Project details on your Resumes/ Portfolios helps you ascertain your claim and creates a good impact on your prospective employer. As in the current market trends, employers not only just look for job seekers with conceptual knowledge but employees with more practical knowledge and skill to work.
Sentiment Analysis
The Sentiment Analysis is utilized by the current generation companies for testing the likeability and preferences of the products in a market. The idea behind this is to find the answers to the succeeding questions.
- Why could the product couldn't reach the desired target sales?
- Why do the customers don't like the product?
- What are the changes that can be made in a product to make it accepted by a maximum number of customers?
- What are the factors that influence the sentiment of customers that can either be product quantity, product price, product quality, or other factors?
A Sentiment Analysis is, hence, a type of analysis which is the opinion of people of a specific service, decision, or product taken. The Opinions shall range from positive to negative polarity. A range of responses could be kept as binary such as Positive or Negative. In a few cases, the responses shall be different options such as Happy, Sad, Angry, Excited, or No Response.
The Data Science project shall therefore use a language like R that can entice the suitable inputs and also analyze it for obtaining the needed information from research work. The use of the recent dataset by the JaneaustenR package can also be built in this specific case. The application of the general-purpose lexicons that shall be made on the sentiment analysis and includes Loughran, AFINN, and Bing. Lastly, you can build the word cloud that helps in interpreting the results.
- Package - JaneaustenR
- Language - R
- Source code - Sentiment Analysis Project in R
Customer Segmentation applying the Machine Learning techniques
Customer Segmentation is one of the vital applications that are used in (B2C Companies). It uses the Clusters of Algorithm for Machine Learning that permits the companies to focus on the exact potential users and they can find out the best customers.
This uses the Clustering techniques via which the companies shall find the different segments of the customers and permits them to focus on the key potential users for the specific campaign. The Customers Segmentation further uses the K-means clustering algorithm that is vital for the clustering that is the unlabeled dataset.
Data Analysis Project of Uber
Data is oil for Uber. With the Data Analysis tool, Uber can derive an important marketing strategy, decisions, predictive analytics, and promotion offers.
With above 15 million rides per day over 600 cities and in more than 65 countries, Uber is growing robustly with the help of Data Science from the very beginning and is crafting better business decisions. Also, it is stated that Data Science occupies a key role in almost every operation of Uber.
Recommendation of Movie
A movie recommendation is based on the inputs obtained from the audiences who have watched the movie firstly. The responses that are collected from them are used for categorizing the movie on the following basis such as funny, interesting, boring, waste, or exciting. The Box Office performances help in guiding the observers to have an idea of sales that a movie has gained in the initial days of the opening. You can make use of the R programming language to execute this project well. The R language primarily helps in recommending the movies using the Machine Learning process. After this, the ML sends the suggestions to the audience by using a filtering process that is based on the preferences of the users who have watched the movie already.
- Package - MovieLens dataset
- Language - R
- Source code - Movie Recommendation System Project in R
A project of Credit Card Fraud Detection using R
A Credit Card Fraud Detection project makes use of the R programming and Machine Learning concepts. The basic aim of this project is to develop a classifier that shall detect the fraudulent transaction that is done through credit card using different Machine Learning Algorithms that will allow you to determine which is fraudulent and which one is not. This is also considered one of the important Data Science projects in the industry.
R & R Studio Installation
We know very well that Python and R are the programming language that is used for deploying the Data Science techniques. Here in this Data Science Tutorial session, we have comprehensively explained the use and application of the R programming language. To do this, you should first install the R and the R Studio to write the R codes to implement them. Hence, in this module of the Data Science tutorial, you will understand the steps for installing the R and the R Studio that is applied in the Data Science as well as the tools and methods.
Follow the below steps to Install the R and Studio
Step 1 - Installation of R
Download an R Installer from the https://cran.r-project.org/
Step 2 - Installation of the R Studio
Download the RStudio: https://www.rstudio.com/products/rstudio/download/
- When you have completed installing the R completely, only then you can run the RStudio installer.
- When you don't have the access to the Administrative rights on the Laptop, step 2 may fail. Then, you should ask the IT Help Desk to download the pre-built zip archive of the RStudio that doesn't require installation. You can find the link for this at the bottom of your download page.
- Download the correct archive to your system
- Now, Double Click on the Zip archive for immediately unpacking it on the predominant Windows Machines.
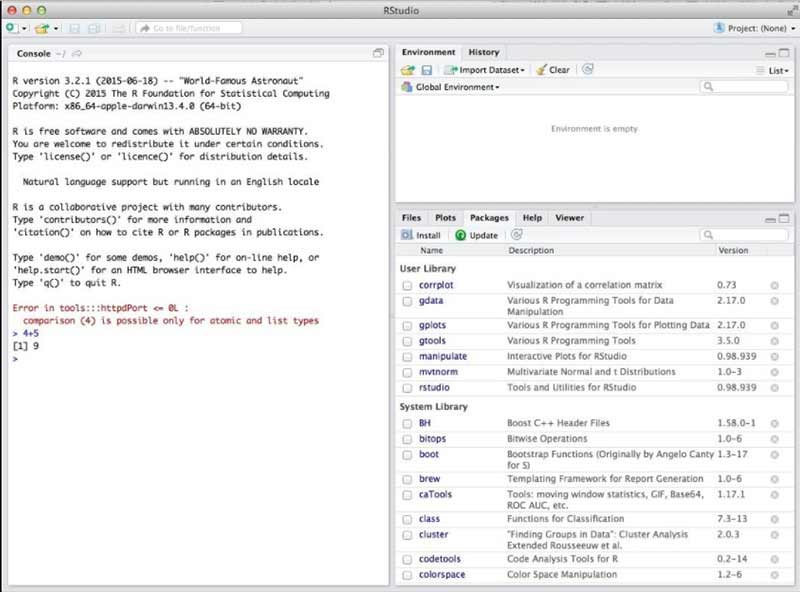
Step 3 - Verify whether the R & RStudio are Working
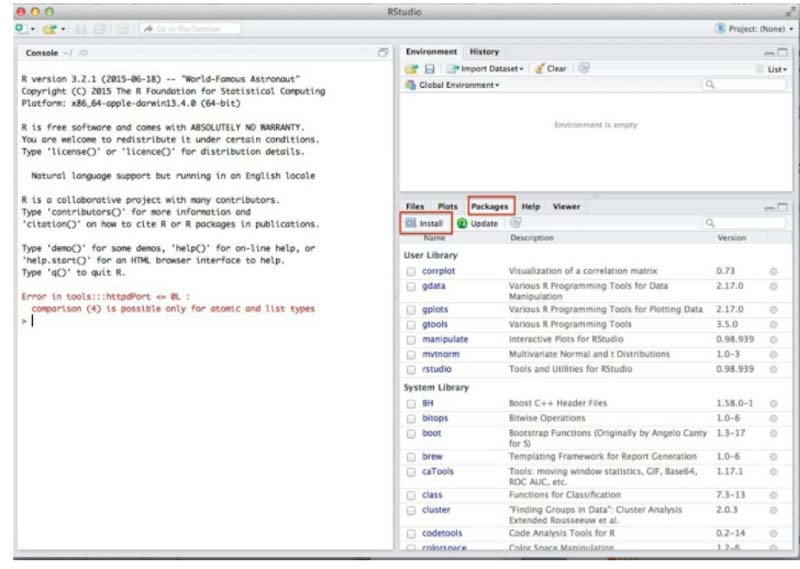
- Open the RStudio. It should be the Open Window that is more similar to the 3rd image that is given.
- On the left-hand Window, by this '>' sign, type '4-5' (without any quotes) and then tap the enter button. The output of the line reading '[1] 9' must appear. It means the R and R Studio is functioning.
- If it is not successful, then you can contact your local IT support for more advice. Image 3 Running R with the R Studio
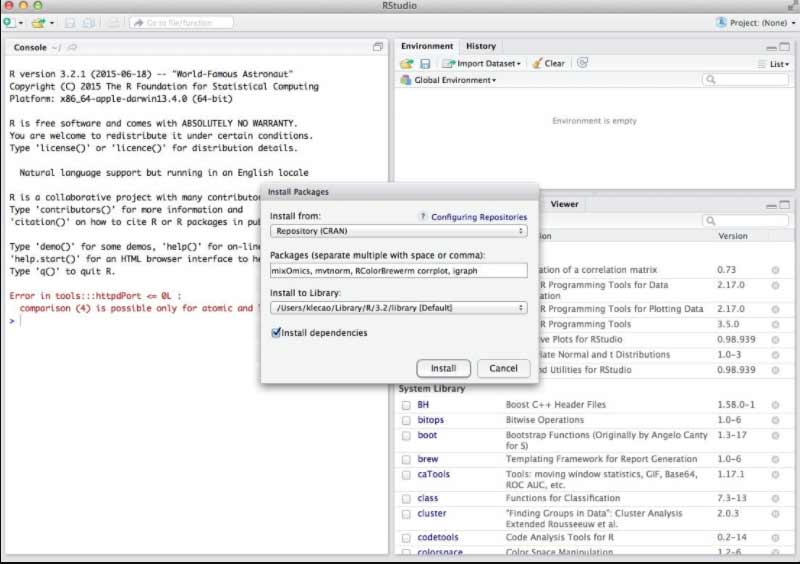
Step 4 - Installation of R Package that is needed for Workshop
Click the tab then go to 'Packages’ → Click Install as displayed in Image 4. Or Navigate to ‘Tools’ → and then select Install Packages.
Now, Install the below Packages
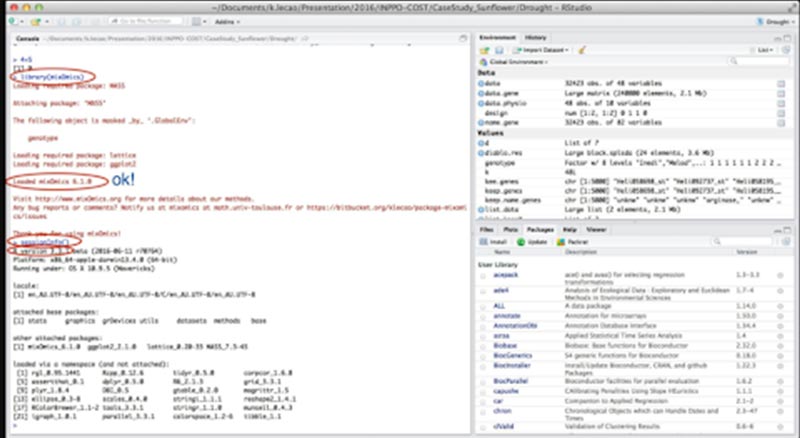
mixOmics version 6.1.0, corrplot, igraph, mvtnorm, RColorBrewer. For the Apple Mac users, when you could not install the mixOmics, then import the library rgl, then you should install the XQuartz software initially which is https://www.xquartz.org/. Now verify the packages that are installed by typing the 'library(mixOmics)' (without any quotes) in a prompt and hit enter.
Later, type 'sesssionInfo()' and then verify that the mixOmics version 6.10 is installed.
Now you can proceed further.
Role of SQL in the Database
SQL is also known as the Standard Querying Language and this is the querying language to all the Relational Databases. Furthermore, it is deemed to be the standard of the present Big Data Platforms that makes use of SQL as the main API for their Relational Databases. In this Data Science Tutorial for Beginners, we will get you through the vital aspects of the SQL and its impact on the current scenario in Data Science.
Significance of SQL in Data Science
By now, you know that Data Science is an Analysis and Study of Data. To Analyze the Data, you should extract it from a database.This is where the SQL gets into the play. RDM is an important aspect of Data Science. Though numerous Modern industries have boosted their product management with NoSQL, yet SQL occupies a predominant position in the CRM industry and in Office Operations.
Most of the Database platforms are modeled after the SQL. It is because it is the benchmark standard for most of the Database systems. The modern Big Data Systems such as Spark, Hadoop, use SQL for maintaining the processing data structure and the relational database system. Whereas the Hadoop gives the features to the batch SQL, Impala and the Apache Drill gives interactive query abilities.
The Apache Spark makes use of the Powerful in-memory SQL system for accelerating the process of the queries. Apart from this to qualify yourself as a professional Data Scientist you must have a good understanding of the SQL queries.
The mandatory SQL Skills needed for a Data Scientist
An upcoming Data Scientist should have the following SQL skills to qualify themselves as an efficient Data Scientist.
- A Clear idea of the Relational Database Model
- In-depth knowledge of the SQL commands
- Indexes
- Null Values
- Joins
- Sub Query
- Creating Tables
- Foreign and Primary Key
A Clear idea of the Relational Database Model
The RDMS that is a Relational Database Model System is a vital concept that should be matriculated by a Data Scientist. To store the structured data, you should have an in-depth understanding of the RDMS. It is because you can retrieve, manipulate, and access the data via SQL at any time. The RDMS is termed to be a Standard benchmark for all the data platforms. It is stated that the Big Data platforms have a major section of RDBMS in it to process the structured information.
In-depth knowledge of the SQL commands
Below are the important SQL Commands that should be known by a Data Scientist,
- Data Control Language
- Data Query Language
- Data Query Language
- Data Manipulation Language
Indexes
By using the Special lookup tables, it is easier for the Database Search engine to locate the values in the row at ease. When you have the idea of SQL indexing, you can import the data into a database rapidly.
Null Values
The Null is used for interpreting the missing values. The field consists of the Null value that is blank in the table. Yet, the Null Value is different from the Zero value or the field that consists of the blank spaces.
Joins
The Table helps in combining the major concepts of the relational databases which a Data Scientist should know. Usually, there are two types of joins and they are the Inner and Outer join. It is further classified into Left, Right, Inner, Full, and much more.
Sub Query
The Subquery is basically a nested query i.e embedded in the other query. The four important subqueries in the SQL are INSERT, SELECT, DELETE, and UPDATE. This returns the information to a primary query.
Creating Tables
Generally, Data Science uses the organized relational tables and it is important to have an idea as to how to create the tables in SQL.
Foreign and Primary key
The Primary key depicts the distinct values in the database. By using the primary key, you can differentiate all the lines and also record them from a database. Whereas, the Foreign Key is used for connecting the two tables.
To conclude the SQL occupies a paramount position in Data Science. Apart from this, the modern Big Data platforms are using SQL to process the organized data which is initiated with the unstructured one. So, having the skills of SQL helps you to have an upper hand at your workplace. Data Science Course in Bangalore at FITA Academy trains you proficient with in-demand skill sets that are highly sought after in the industry with certification under the mentorship of Expert Data Science professionals.
Reason to use Apache Spark for Data Science
The Apache Spark is a distributed and open-source processing system that is used for Big Data workloads primarily. Apache Spark uses in-memory caching and the optimized query for the execution of the queries rapidly against any size of data. Also, in general, Spark is the general engine that is a rapid tool that is used for processing large-scale data.
Over here the term rapid indicates it is two-fold times faster than the earlier approaches. The reason behind the rapid speed in the Spark is that it runs on the memory (RAM), and it makes the processing much quicker than it is on the disk drives. Ang again over here the term 'general' indicates that it can be utilized for different things such as creating data pipelines, running distributed SQL, running Machine Learning algorithms, ingesting the data into the databases, data streams, or working with the graphs, and many more.
Features of the Apache Spark
- Faster Processing - The important feature of the Apache Spark is that Big Data chose this tool over others owing to its speed. Big Data is attributed by its velocity, veracity, and volume that is required to be processed at a faster pace. The Spark consists of the Resilient Distributed Dataset(RDD) that saves time in writing and reading the operation and permits it to run more than 100 times faster than the Hadoop.
- Real-time Processing - Spark can process real-time streaming data. On contrary to the MapReduce that processes only the stored data, Spark is also capable of processing the real-time data and is, hence, we can instantly produce the outcomes.
- Flexibility - The Apache Spark enables the support of different languages and permits the developers for writing applications such as Java, Python, R, and Scala.
- Better Analytics - When compared to the MapReduce, it involves the Map & Reduces functions, that Spark consists of more than it. The Apache Spark contains a rich set of complex analytics, SQL queries, and Machine learning algorithms. With all the above functionalities, the analytics shall be performed in a better manner with aid of Spark
- In-memory Computing - The Spark Stores the data in the RAM of the Servers that allows you to access and in return accelerate the speed of the analytics.The Apache Spark has seen tremendous growth over the past few years, and it has turned out to be the efficient data processing tool and the AI engine in the enterprises currently, owing to the speed of use, ease in application, and sophisticated analytics provided by it. Yet, the cost of the Spark is higher, and it needs more RAM for running the in-memory. The Spark consolidates the data and the AI by streamlining the data preparation at a huge scale across different sources. Further, it gives a consistent set of API for both the Data Science and Data Engineering workloads with the seamless integration of rich libraries like SciKit-Learn, PyTorch, R, and TensorFlow.
Top Data Science tools
Data Science is stated to be the boon of both the IT and Non -IT business today. Data Scientists support you to gain information on the market and its products better. The Data Scientist functions as the Decision Makers and they are immensely held responsible for handling and analyzing a large number of structured and unstructured data. To do this, a Data Scientist needs various tools and technologies for analyzing and generating predictions. Here in this Data Science Tutorial, let us see the top Data Science tools,
The Top Data Science tools include
- SAS
- D3.js
- Apache Spark
- Excel
- MATLAB
- Tableau
- ggPlot2
- Tensor Flow
- Scikit Learn
- NLTK
SAS
This is one of the best Data Science tools that is curated specifically for statistical operations. The SAS is one of the closed source proprietary software which is utilized by large and medium scale operations for analyzing the data. The SAS uses the Base SAS programming language that aids in executing the statistical modeling. SAS is one of the widely used software companies of various scales and the most preferred software among the professionals owing to its reliability. The SAS provides different Statistical tools and libraries for the Data Scientist to organize and model the data. Though SAS is the most reliable and robust software, it is too expensive that it can be used only by large scale industries.
D3.js
Javascript is primarily used as the Client-side scripting language. The D3.js is the Javascript library that permits you to build interactive visualization on your web-browser. With numerous APIs of the D3.js, you can use the different functions for creating the dynamic analysis and visualization of the data on your browser. Apart from this, the most powerful feature of the D3.js is the application of animated transitions. The D3.js builds the document robustly by permitting updates on the client-side and fervently uses the changes that are made on the data for reflecting the visualization of the browser.
Apache Spark
The Apache Spark which is also called Spark normally is one of the powerful analytics engines that can be found on the tool kits of a majority of the Data scientists. A Spark is specifically created for designing and handling the batch processes and stream processes. This comes with numerous APIs, which allows the Data Scientist to make the replicated access to the data for Storage in SQL, Machine Learning, etc. Apache is an upgraded version when compared to Hadoop and this can perform 100 times quicker than MapReduce. The Spark consists of numerous Machine Learning APIs that allow the Data Scientists in anticipating the best predictions of the given data.
Excel
Apparently, this is the most commonly used Data Analytics tool. Excel was developed by Microsoft specially for spreadsheet calculations and currently, this is the widely utilized tool for the data visualization, processing, and complex calculations. It is a robust analytical tool for the Data Science field. Excel helps Data Scientists with numerous tables, filters, slicers, and formulas. You can also develop your custom formulas and function using excel. Though Excel is not suitable for calculating the vast amount of data, yet it is one of the ideal options to create impactful Data Spreadsheets and Visualizations. A majority of the Data Scientists use Excel to perform data cleansing and it gives an interactable GUI environment for pre-processing the information at ease.
MATLA
It is a multi-paradigm numerical computing environment that is used for processing mathematical data. This is the closed-source software that supports the functionalities such as statistical modeling of data, algorithmic execution, and matrix capacities. MATLAB, in general, is used across an array of scientific disciplines. Data Scientists use MATLAB for replicating fluffy rationale and neural systems. Using the MATLAB Graphics library,you can build the best visualization.
This tool is further used in signal and image processing. And this makes it one of the distinct tools for the Data Scientist as it can tackle the issues right from the data cleansing and data analysis. Also, it can further support the matured Deep Learning algorithms.
Tableau
It is the best Data Visualization Software which is a bundle pack tool with the best powerful graphics for making interactive visualization. This tool is widely used in the domain of Business Intelligence. The key highlight feature of the Tableau software is that it has the capacity to interface with the OLAP, Databases, Spreadsheets, etc. With this feature, the Tableau software has the attribute to visualize the geographical data and also the ability to plot the latitudes and longitudes in the maps. Apart from visualizations, you can also use Tableau as the Analytics tool for evaluating the data. The Tableau provides an active community where you can share and find many insights on this online platform. And Tableau is the enterprise software that comes with the free version known as Tableau Public.
ggPlot2
It is the advanced data visualization package that is majorly used for the R Programming language. The ggPlot2 tool was basically created for replacing the native graphics package of the R and this is the most resourceful command that is used for creating the illustrious visualizations. This is one of the commonly used libraries among the Data Scientists for creating insightful visualization from the analyzed data. It is the part of the tidyverse, which is one of the packages in the R that is developed specifically for Data Science. The best feature of ggplot 2 is that it is much better than the rest of the tool when it comes to data visualizations and aesthetics. With ggplot2, the Data Scientist can develop customized visualization for developing engaging and storytelling visualizations. When you use the ggplot2, you can comment your data in the visualizations, add labels to the data points, and enhance the explanation of your graphs efficiently. With ggplot 2 you can create different styles of maps like hexbins, cartograms, and choropleths.
Tensor Flow
It is the standard tool that is used for Machine Learning. It is broadly used as the Advanced Machine Learning algorithms such as Deep Learning. The Developers termed TensorFlow after the Tensors which are the multidimensional arrays. This is an open-source and ever-expanding toolkit that is known for the computational capabilities and high performance. The TensorFlow can run on both GPUs & CPUs and it has currently surfaced as one of the powerful TPU platforms. It has given an unprecedented edge when it comes to terms of processing the power of advanced machine learning algorithms.
Scikit Learn
It is the library that has predominated its origin to Python and is used for deploying the Machine Learning Algorithms. This is an easy and simple deployable tool that is broadly used for data science and analysis. This supports different features in Machine Learning like classification, clustering, regression, data preprocessing, dimensionality, and clustering. This tool is more suitable for the situation that needs rapid prototyping and it is the ideal option for the platform which performs the research that needs the fundamentals of Machine Learning. This uses the different libraries of Python namely Numpy, Matplotib, and SciPy.
NLTK
NLTK which is also Natural Language Processing ToolKit (NLTK) that has gushed to be the most popular domain in Data Science. It handles the development of the statistical models that are part of Machine Learning and via numerous of its algorithms that assist the computers in comprehending the natural language. It is broadly used for different language processing techniques such as tagging, parsing, stemming, tokenization, & machine learning. This includes over 100 corpora that are the compilation of the data for developing the Machine Learning models. This has a different type of applications namely Word Segmentation, Parts of Speech Tagging, Machine Translation, Text to Speech Recognition, and much more.
Significance of Data Science in Business
Data Science or the branch that trades with the analysis, exploration, generation of useful insights from the data or modeling has created a buzz across a wide range of industries. The Utilization or the Application of Data Analytics is something that businesses can not afford to ignore in the coming days. Organizations have begun to recognize that they incredibly rely on the treasure hoard of the data. Though Big Data at times turn out to be difficult and complex for apprehending, yet the businesses that instrument the strategies and the systems for analyzing, collecting, and using data shall experience weighable benefits in different areas of operations.
Currently, the professionals who are capable of harnessing the power of the data with help of Data Science methods are highly valued. Because these professionals guide the organization in all aspects to boost the business. There are numerous methods as to how to apply Data Science in business to increase its growth. Below in this Data Science Tutorial are the possible ways in which Data Science helps the businesses specifically and they are,
- Better Decision Making
- Recruiting the Best Talent
- Enhancing the Relevance of your Product
- Training your Staff
- Identifying your Target Audience
Better Decision Making
Using Data Science in your Business, you can drive in better traffic or lead to your product in the market through two different ways and they are: You can customize the service or the product to make them more personal or you can motivate your customer with a new experience of the product or the service. Currently, the Machine Learning algorithm has gained significant traction among businesses in terms of making a customer purchase a product or to make a breakthrough innovation. There are three different kinds of Machine Learning Algorithms and they are Supervised, Unsupervised, and Reinforcement learning. Over here, we will drive you deep into supervised and unsupervised learning with real-time examples and how these algorithms help you to benefit your product.
A few times, the discussion of Supervised and Unsupervised learning may become complex and so here we have given you a clear outline of what these learning are all about. Generally, Supervised Learning is about forecasting the outcome, whereas Unsupervised Learning is all about finding the pattern. Both of these methods of learning aids you in delivering the products to your respective customer promptly and helps you to understand them better.
Supervised Learning is used for predicting the customer's behavior. Here, you solve it by removing the classification problem, the Machine Learning Engineers also help you to find the Satisfied and Unsatisfied customers and anticipate the churns. The best examples of Supervised Learning are Image Classification, Speech Recognition, and Face Recognition. These are the features that modify the customer experience and it makes the tech products more attractive to use, namely instructing the virtual assistants to make a scheduled meeting rather than accessing the scheduling software to find the suitable time, event, meeting type, and details.
Unsupervised Learning permits you to seize your customer preferences and use those data for anticipating their behavior and needs in the upcoming future. Some of the best examples of Unsupervised Learning are Amazon's and Netflix's recommendations and also Spotify's music suggestions that are being suggested based on the movies and music you have watched, listened, and liked. For building these types of recommendations, the data scientists should solve the clustering problem or group the same users together for forming homogeneous clusters.
With this, the businesses shall learn which solution should be taken for the best possible outcome and suggest logic for the best-case scenario actions for enhancing the performance. Essentially, by recording the performance metrics and analysis you have derived over time, your company becomes more smarter and proficient in decision-making to cohere to the recurring trends.
Recruiting the Best Talent
Recruiting is one of the exhausting tasks in an organization. However, with Data Science the processes can be simplified and made more accurate. By collating all the data that are available on social media, job sites, corporate databases the companies shall work via these data points and the analytical methods for determining the candidates who are eligible for the organization.
And mining these existing data on your applications indicates identifying the suitable employees who can fit into your company culture and not just the one who looks better on the papers. It is most important when you get a large number of applicants and when you are seeking to fill in a position quickly. With the help of Data Science, you can scrutinize and select the perfect candidate for the job easily.
Enhancing the Relevance of your Product
The Data Science methodologies help you to explore the history, make a comparison to the competition, inspect the market conditions, and finally make the best recommendation of where and when your products or the services would sell the best. And this helps the company to apprehend how their products aid others and the other required question that is prevailing in the business processes. This perpetual analysis and the reflection of using data science enables an in-depth understanding of a market's response to the company's services or products. On a closer note, you will have an extensive understanding of how your product is utilized and the most you can do after this is to have an alter thinking to provide solutions that your customers may require more.
Training your Staff
Though you have the right set of staff, keeping all of them informed and updated shall be a daunting task. Data Science helps you to extract the insights that your employees must know. Once you have obtained the required insight and knowledge you can use them to populate online knowledge and the base software or the IT documentation software which hold essential knowledge for the employees to refer to. On pulling the hard data and giving the facts and statistics for the employees you can access them anytime, by this way you also help in creating a savvy team that can use those insights for driving more business.
Identifying your Target Audience
On average, it is stated that roughly there are more than 2.5 billion GBs of data every day. With the ceaseless amount of growing data, gathering the data which is more important for your business and customers can be an up struggle. All pieces of data that are collected from your company or from your customers - be it the social media websites or the email surveys that consist of data which can be used for analyzing and understanding your customers better. Using the Data Science methods from the information gathered from your customers, you shall combine the data points for improving the insights of your target audience effectively.
Also, with this, you can tailor the product and services to specific groups. For instance, identifying the correlation between the age of the employees and their income shall help the company significantly to make offers or promotions for the groups which may not be available for them earlier. Applying the Data Science methodology via your business could add value in different ways among recruiting, training, marketing, and decision making. The Data Analysis can allow you to make an informed decision that permits your company to expand in the most strategic ways.
On the end note, it is very clear that Data Science methods and applications are more important for can help you with almost everything and anything that is related to an organization. Furthermore, with Data Science you can make more informed decisions that benefit a business significantly. Data Science Course in Hyderabad at FITA Academy provides you a comprehensive training of the Data Science concepts and their applications in the real-life world under Expert Data Science professionals.
Role of Data Science in Various Field
In the current age, if you can work with Data, then your career is all set on the lucrative path. The world of business today is widely embracing Data Scientists, owing to their exceptional skills. The Bigger Organizations globally are manipulating the source of customer data for enhancing their revenues and services, and this has created a surge for recruiting the skilled Data Scientists who help the organizations in extracting the value of the puzzling data sets.
Henceforth, upon choosing Data Science as your mainstream you will have a bright and fruitful future if you know Statistics, Data Visualization & Communication, Machine Learning Algorithms, and Data Munging with other basic tools. And this is possible only when you have a clear picture of the industry that you are going to be a part of. So, opting for the correct industry is vital for ripping the at utmost benefits of the Data Science profession. Below are the fields where Data Science and its applications are being adopted broadly.
- Agricultural Sector
- Automotive Industry
- Internet Industry
- Energy Sector
- Health and Pharmaceutical
- Banking and Finance
Agricultural Sector
We all knew that Agriculture is the backbone of the Indian economy. Yet this is the one of the fields that surfaces lots of hurdles such as droughts, unpredictable monsoon, climate change, and migration of framers to other job profiles due to less or no income. It is a well-known fact that the people who belong to the framing and agricultural community are the least taken care of in India though they are the ones who feed us. Besides, factors like natural calamities and people, in general, being prejudiced on the other hand the Government and other private institutions that were formed for the purpose to aid the farmers and agricultural land also failed to support the framers in terms of loans and welfare schemes. Over here, Data Science can be a source of rescuer for the farmers and agriculturalists by aiding them with all the technical assistance and help them to overcome the crisis of natural disasters and unforeseen situations with the required guidance.
Data Science helps farmers with ‘Crop Mapping’ and ‘Digital Soil’. It is associated with building digital maps for various kinds of soil and properties. Few farmers in the agricultural field deal with acres and acres of land that might be almost inaccessible for them to get timely updates and alerts of the potential problems that are awaiting. However, with the help of Data Science technology, it is easier for them to forecast the upcoming situation. Countries like Ireland rely on Satellite-based crop and soil monitoring for surveying the areas that are faster than the traditional methods which permit. It helps in determining what crops should be grown in a specific area of land based on the suitability and climatic conditions. This indeed saves the efforts largely and the time spent on it to yield a higher production. Thus, implementing the Data Science technologies in the Agricultural domain will surely provide wider benefits.
Automotive Industry
Data Science Professionals do have a wide scope to play in the automotive industry. Machine Learning, Artificial Intelligence, and Data Science are major technologies that permit the Automotive industry to combat the different challenges and remodel itself. Currently, you would have witnessed a tremendous drift where the world is widely adopting Automation technology to save time and increase productivity as well. Choosing this sector provides you a great chance of scope for broadening the range of skills and creating products with maximum optimization and automatic learning features.
Internet Industry
The Internet industry is obtaining significant momentum and strength as the result of increased data spikes that is generated by sophisticated technologies like Big Data, Cloud Computing, and the Internet of Things. Now, the Data Scientists have troves of data that are generated from these sophisticated technologies in their hands, and with this, they use it for designing personalized recommendations, video analysis, and undertaking sentiment analysis. And so, the Internet Industry or the Social Networks, or the e-Commerce sites are thriving at an unprecedented level of people who use the internet for posting pictures and videos on the social media websites, making Google searches for every second of a day, and purchasing a product online. Thus, Data Scientists have an essential role in this domain with the growing number of internet users.
Energy Sector
Data Science is constantly exhibiting its transmuting powers and attributes in reshaping the Energy verticals. The Data Analysts have constantly proved to be highly resourceful in discovering the offbeat energy resources, and ways to reduce the costs and save time and money for drilling and exploration, to enhance productivity, and reducing power outages, and much more. Data Science techniques are also helping significantly to curb the instances of accidents by providing better repairs.
Health and Pharmaceutical
The Medicine industry is making use of Data Analytics and Big Data significantly to improve the facility of the medical conditions that are prevailing currently across the globe. The Data Science techniques have contributed enormously in this sector and it will persist to contribute higher in the upcoming days as well. One of the notable examples of the application of the Data Science technique in the medical industry is the utilization of wearable trackers for giving important information to the Physicians who make use of the data to serve their patients with better care and treatment. These Wearable trackers give information to the Doctors such as whether a patient is following the medication as prescribed to them. Over time, the Data that has been accumulated from the tracker gives the Physicians comprehensive information of the patient's well being than short visits that are given by the patients.
Banking and Finance
Though on the outer look it seems like that the Banking industry does not use Data Science technology more. Yet, it has begun to change the Bankers tremendously in using this technology for driving and making decisions. For example, the Bank of America uses the techniques of Predictive Analytics and Natural Language processing for creating a virtual assistant named ‘Erica’ for helping the customers to view the information on the bills and the transaction histories. It is also mentioned that the Bank of America representatives have said that the assistants get smarter eventually on reading the customer's banking habits and recommend them the appropriate financial advice during the crucial times.
Data Science Use Cases
The term Data Science has created more jargon in the IT industry. Currently, all the industry in the world needs data. With the amelioration in the computational capabilities, the companies can analyze the large scale of data and comprehend the insights from the hoards of information. Additionally, with the help of Data Science techniques, organizations are making even more informed data-driven decisions. Below are the top lists of use cases where Data Science techniques are being applied,
- Fraud and Detection
- Website Recommendation
- Gaming
- Airline Route Planning
- Advanced Image Recognition
Fraud and Detection
The Primal application of Data Science was found in the Finance sector. Earlier the finance or the banking sector faced a lot of bad debts or losses year after year. To overcome the losses they began collecting the data at the beginning of the sanction of a loan. With the passage of time, the companies understood how to conquer and divide the data through customer profiling, past expenditures, and other key variables for analyzing the probabilities of the risk and default. Further, it aided them to push their banking products on the basis of the purchasing power of the customers.
Website Recommendation
By now every one of us has got used to the suggestions on similar products on Flipkart or Amazon. This suggestion not only helps in finding the products that are relevant from billions of products that are found on the online platform but also adds a lot to the user experience. In fact, most of the companies have used this engine fervently to promote their products in accordance with the user's preference and relevance of information gained. Some of the popular Internet giants that use this system for improving their user experience are Google Play, Netflix, Linked In, Twitter, and Amazon. These recommendations are made upon the earlier search results of a user.
Gaming
Currently, Games are now developed using Machine Learning Algorithms that upgrade themselves as a player to proceed to the next level. Also, while playing the motion games, your opponent does analyze your earlier moves and modifies the game according to it. The best examples of the companies that have used Data Science for making the best user experience are EA Sports, Nintendo, Activision-Blizzard, Zynga, and Sony.
Airline Route Planning
It is a known fact that the Airline Industry across the globe is anticipated to bear a heavy loss. Apart from a few Airline Service providers and companies that are striving to manage their operating profits and occupancy ratio. With a significant rise in the air-fuel prices and the need to provide huge discounts to the customers have a further complicated situation. Now, with the implementation of the Data Science techniques the companies can:
- Forecast a delay in the flight
- Selecting which class of Airplanes to be purchased
- Deciding whether to land a flight to a destination directly or should the plane should take a halt halfway.
- Able to drive the customer's loyalty programs efficiently.
For Example, Alaska Airlines, Southwest Airlines are some of the top companies that have embraced Data Science for bringing in changes and the way of functioning.
Advanced Image Recognition
When you upload photos of yourself and friends on Facebook you will get suggestions as to tag your friends as well. This Automatic Tag suggestion feature is populated with the use of the face recognition algorithm. In a recent update, Facebook has defined the further progress that they made in this area by making a special note on the advances in image recognition capacity and accuracy. Further, Google gives you the option for searching for images by uploading them. This uses image recognition and gives related search results.
Data Science Course in Coimbatore at FITA Academy trains you holistically of the Data Science concepts, techniques, along with its tools under the mentorship of real-time Data Science professionals with certification.
How to Make a Career in Data Science?
Step 1 - Practice and Get a Real-Life Experience
It is preferable to step into a Professional Institute where you can learn the concepts right from the basics to the complex topics with real-time examples and training under the training of Expert Data Science professionals. Only in a Professional institute, you will get complete guidance from the mentor where they will comprehend the intricacies proficiently.
Step 2 - Take Projects
It is advisable to take on Data Science projects that help you to have a clear idea of what Data Science is all about. You can undertake a Data Science project easily when you step into a professional institute as the mentors over there guide you through it and support you in completing the project successfully by clarifying the doubts. Apart from this, you can enroll for other online projects that are found in abundance on the online platform which is specifically curated for the Data Science aspirants who seek to pursue their career in this domain.
Step 3 - Engage in the Data Science community
It is more important to contribute to and engage in the Data Science community. Having a strong presence in the Data Science learning community keeps you updated with all the recent changes and practices. To have an active presence on this online platform, you must engage yourself in writing blogs, tutorials, and Articles. If not this, you can also write comments and suggestions for those who have raised questions on the forums. StackOverflow is one of the notable Data Science Community where you can find a pool of Data Scientists and other technology aspirants sharing their views and ideas on the forum with varying degrees. This helps you significantly in knowledge gaining and sharing.
Step 4 - Have a Strong Online Presence
Show yourself visible online by dedicating yourself to work. To do that create an account on the LinkedIn platform and build your profile in a compelling manner. Craft and align your profile in the sequence from the most to least important details. For instance, in case if you have written a blog or article on WordPress related to any technology mention them on your LinkedIn profile. This in a way will help to significantly highlight your profile among the yen number of competitors and applicants. Also, share the details regarding the project and case studies you have undertaken. So, your profile will be boosted and be noted by all. Below we have given you an example of how to fill in your details.
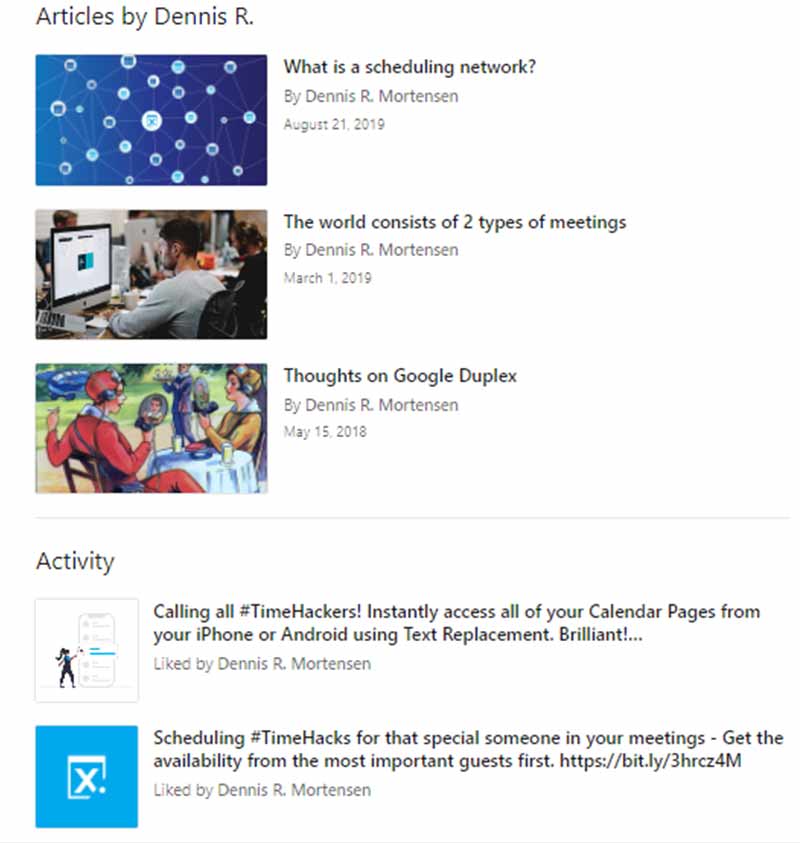
Step 5 - Networking
Building a good Network is the other important requirement to secure your interview. To build an active network you must have a strong online presence on the LinkedIn platform, Online Forums, and Data Science community. This helps in influencing your prospective employer to gain a good opinion.
Step 6 - Build a Strong & Professional Resume
Your Resumes must reflect your skills efficiently. It can be done by adding the correct personal details and your key attributes. Build a Portfolio or Resume that enlists the relevant Data Science projects in which you have contributed to or built. To do this, you should have a sound knowledge of Statistical and Programming skills and you should participate in projects. One of the key aspects of securing a Data Science career is keeping your profile updated. This showcases your discipline and punctuality.
Step 7 - Take your First Job in the Start-up, or Mid-level, or the high-level company
It is a known fact that people at the MNCs are already oppressed with more work. They either have the time or the patience to guide you from the basics. Whereas, in the Mid-level company, there are possibilities where you don't have much time to work in the startup or you may be asked to multitask. The thing we insist on here is that you must focus on an environment where you can learn the nature of your work holistically and imbibe all the required attributes to work as a professional Data Scientist. It is preferable to step into a ‘startup organization where you will be given the required space to learn and practice what you preach’. This is one of the best ways to mold your career.
Note
This is just a suggestion, adhering to it or not is up to an individual's preference. At the initial stage of your career, you should focus more on the learning aspect and enhancing your skills. Because this is the phase where you will be given ample time to upskill yourself. Learn the maximum during this stage without focusing on the monetary aspects. This unseen foundation that will help you build your career path strong in the future. So, enduringly toil on the dreams and develop a strong attribute and foundation to experience success whilst overcoming the challenges and adversities.
Data Science Career Opportunities
The demand for Data Scientist professionals is growing multifold times at present. It is one of the promising and flourishing careers that can be opted for with no shadow of a doubt. The reason behind the significant demand for Data Scientist professionals is that the world is generating data at an exponential range. Based on the reports submitted by the International Data Corporation (IDC) the future of the global data sphere will rise from 33 zettabytes to 175 zettabytes by 2025. On average, almost, 30% of the World's Data may require real-time processing. Apart from this, it is stated that more industries have benefited from using Data Analytics for improving business practices this has significantly resulted in the explosion of career opportunities in the Data Science and Big Data domain. According to the reports published by the Bureau of Labor Statistics, it is stated career growth in Data Science is expected to rise 11% between 2014 to 2024 which is significantly higher when compared with the other streams of career choices.
In recent years, if you have watched closely the growth of a company you can find that the company was able to witness tremendous growth on the adoption of the Data Analysis. Also, this technology is not limited to one specific field. The Data Science techniques can be applied across an array of sectors such as Logistics, Banking, Health & Medicine, Insurance, Gaming, e-Commerce platforms, FMCG, and Agriculture. The top companies that majorly depend on Data Science techniques are Apple, Microsoft, Facebook, Google, and Amazon. Also, it is stated that in these above-mentioned companies they have almost employed one-half of the gross Data Scientists around the globe. Maybe this is one of the reasons that these companies managed to stay on the top of the chart.
The Job Roles that are offered in the organizations on obtaining the Data Science skill sets are Data Engineer, Data Scientists, Data Analysts, Business Analyst, Marketing Analyst, Data Architect, Data Administrator, and Business Intelligence Manager. Let us now see some of the top profiles, roles, and skills that should be obtained by them.
Data Scientist
A Data Scientist has many things to do and they are more similar to that of Data Analysts. It is because the Data Scientists also typically build models that make more accurate predictions of the business problems.
The important role of the Data Scientist is that they should have the capacity for explaining the significance of the data in an easier manner that can be understood by all.
Skills Required
Python, SAS, R, Statistical and Mathematical knowledge, Cloud tools, Data Mining, Cleansing & Munging skills. Apart from this, the Data Scientist should possess the attribute of good analytical thinking and communication skills.
Data Analysts
The prime role of a Data analyst is to find the market trend of the business. An Analyst should be able to provide a clear graph of the company's holding position in the market. In case if you achieved the desired goal that is set by the company, then the Data Analyst aids you with the datasets for attaining the targeted goal. Usually, the role of the Data Scientist may change according to the need of a company.
Skills Required
Data Analysts should possess critical Analytical thinking, Data Visualization skills, SQL Databases, Advanced MS Excel, Programming languages like SAS & R, Fundamental of Machine learning, and Good communication skills.
Business Intelligence Analysts
The Business Intelligence Analysts also assist in analyzing the collated data for optimizing the organization's efficiency and to generate higher profits. Their roles are more technical than analytical and it needs the idea of popular machines. They act as the bridge between IT and Businesses for helping them to improve. The Business Intelligence Analyst is needed to obtain knowledge of the specific industry and the current trend in it.
Skills Required
A demonstrable knowledge of Analytical skills, Fundamentals of Statistics, Advanced knowledge of MS Excel for cleaning the Data, and a very good understanding of IT.
Statistician
The Statistician is needed to have a better understanding of the changing market brands, trends, analyzing, and convert them to meaningful insight into various formats. The designation of this role itself suggests having a good background in Statistics. Earlier the term Statistician referred to the term Data Scientist and so basically their work is more similar to that of a Data Scientist. However, the Data Scientist is just one level higher than them.
Skills Required
The Statistician is required to have a good command of the statistics concepts, Computer literacy, Mathematical ability, Analytical Skills, R programming, and communication skills.
Data Engineer
The Data Engineer not only analyzes the Data but also handles the company's Data infrastructure. The Data Engineers are held responsible for building specific data infrastructure for getting the marketing and sales data to the Data Scientists and Analysts in a functional manner for further analysis.
Skills Required
The Data Engineer is required to have a stronghold on the Data warehousing and Database architecture. The Engineer should build and design large-scale applications. The Data Engineer is required to have knowledge of the programming languages like Java, MATLAB, Python, SAS, R, and C/C++. Also, the Data Engineer is expected to have demonstrable knowledge of Operating Systems such as Linux, UNIX, and Solaris. In-depth knowledge of Machine learning and SQL skills.
Database Administrator
The Database Administrator uses different software for organizing and storing the company's data. The Database Administrator is responsible for developing, planning, integrating, and security of databases that are available for all the employees to use it. They are held responsible for defining and remaining persistent across databases.
Skills Required
The Database Administrator is expected to be familiar with the Database designs and data manipulation languages. The Database Administrator is required to have good analytical and problem-solving skills. The Database Administrator is needed to have a good understanding of the Adminer, DatabaseSpy, Workbench, and MySQL.
Remuneration and Package
- The Entry-level candidate shall earn up to Rs.3,50,000 - Rs.4,50,000 yearly.
- The Mid-level candidate is paid around Rs.7,20,000 - Rs.8,50,000 per annum.
- The Senior-level candidate is paid around Rs.10,00,000 - Rs.13,50,000 yearly.
Important Data Science Notes for Beginners
The median package and remuneration may differ based on the organization you step in and also based on the knowledge and skill sets you have gained.
Future of Data Science
The future of data science is very encouraging. With the ever-growing data, opportunities in data science seem to be endless. There is a massive explosion and creation in data. A tremendous amount of data is created every day. There are plenty of reports on data science. According to the majority of these reports, Data science has been entitled as the most desirable job of the 21st century. And, for three years in a row, data science is labelled as the number one job in the US by Glassdoor. These are all lucrative and extravagant titles awarded to data science. Everyone wants to know what the future holds, more or less wants to predict the future. Knowing what you could do differently that will mold the future doesn’t hurt anyone. Data science helps in understanding how certain specifications, if taken into consideration, will keep you to stay ahead in the competition.
The future of data science is very splendid and thriving with multiple researches indicating a consistent rise in job opportunities in the field of data science; as well as business organizations being volatile towards investing more and more in improving and managing their data infrastructure and promoting data science implementations.
Data science is a profitable, an in-demand role that is branching out to various domains. Data science has already achieved commendable performance in health services, finance, e-commerce industries, gaming, and sports among many others. It is just the beginning of something that has exceptional potential.
Endnotes
Data Science is one of the flourishing careers with broader career scope where it is worth investing your time and money in it. And so, choosing the right steps leads you to a lucrative career path. We hope this Data Science tutorial helped you with all the necessary guidance that you sought. For further guidance and training, you enroll in the Data Science Courses @ FITA Academy and upskill your career path. We offer you both online and offline training with maximum practical training practices.
Interview Questions
Interview Questions on Digital Marketing Java Interview Questions For Experienced Selenium Interview Questions and Answers For Experienced Hadoop Interview Questions and Answers For Experienced Python Interview Questions and Answers For AWS Interview Questions and Answers For Experienced DevOps Interview Questions and Answers Oracle Interview Questions PHP Interview Questions For Freshers AngularJs Interview Questions RPA Interview Questions Software Testing Interview Question and Answer Mobile Testing Interview Questions and Answers Salesforce Interview Questions Networking Interview Questions and Answers Pega Interview Questions NodeJS Interview Questions Ethical Hacking Interview Questions Data Science Interview Questions and Answers Javascript Interview Questions Blue Prism Interview Questions SEO Interview Questions Android Interview Questions MS Excel Interview Questions Cloud Computing Interview Questions Cyber Security Interview Questions Interview Question on Tableau Power BI Interview Questions and Answers Artificial Intelligence Interview Questions and Answers Azure Interview Questions and Answers SQL Interview Questions and Answers Full Stack Interview Questions and Answers Dot Net Interview QuestionsFull Stack Interview Questions and Answers UI UX Interview Questions and Answers ReactJs Interview Questions Full Stack Interview Questions and Answers Linux Interview Questions
Contact Us
For Business
Testimonials
Resources
Follow Us
TRENDING COURSES
JAVA Training In Chennai Core Java Training in Chennai Software Testing Training In Chennai Selenium Training In Chennai Python Training in Chennai Data Science Course In Chennai C / C++ Training In Chennai PHP Training In Chennai AngularJS Training in Chennai Dot Net Training In Chennai DevOps Training In Chennai German Classes In Chennai Spring Training in ChennaiStruts Training in Chennai Web Designing Course In Chennai Android Training In Chennai AWS Training in Chennai
iOS Training In Chennai SEO Training In Chennai Oracle Training In Chennai RPA Training In Chennai Cloud Computing Training In Chennai Big Data Hadoop Training In Chennai Digital Marketing Course In Chennai UNIX Training In Chennai Placement Training In Chennai Artificial Intelligence Course in ChennaiJavascript Training in ChennaiHibernate Training in ChennaiHTML5 Training in ChennaiPhotoshop Classes in ChennaiMobile Testing Training in ChennaiQTP Training in ChennaiLoadRunner Training in ChennaiDrupal Training in ChennaiManual Testing Training in ChennaiWordPress Training in ChennaiSAS Training in ChennaiClinical SAS Training in ChennaiBlue Prism Training in ChennaiMachine Learning course in ChennaiMicrosoft Azure Training in ChennaiSelenium with Python Training in ChennaiUiPath Training in ChennaiMicrosoft Dynamics CRM Training in ChennaiUI UX Design course in ChennaiSalesforce Training in ChennaiVMware Training in ChennaiR Training in ChennaiAutomation Anywhere Training in ChennaiTally course in ChennaiReactJS Training in ChennaiCCNA course in ChennaiEthical Hacking course in ChennaiGST Training in ChennaiIELTS Coaching in ChennaiSpoken English Classes in ChennaiSpanish Classes in ChennaiJapanese Classes in ChennaiTOEFL Coaching in ChennaiFrench Classes in ChennaiInformatica Training in ChennaiInformatica MDM Training in ChennaiData Analytics Courses in ChennaiFull Stack Developer Course in ChennaiHadoop Admin Training in ChennaiBlockchain Training in ChennaiIonic Training in ChennaiIoT Training in ChennaiXamarin Training In ChennaiNode JS Training In ChennaiContent Writing Course in ChennaiAdvanced Excel Training In ChennaiCorporate Training in ChennaiEmbedded Training In ChennaiLinux Training In ChennaiOracle DBA Training In ChennaiPEGA Training In ChennaiPrimavera Training In ChennaiTableau Training In ChennaiSpark Training In ChennaiGraphic Design Courses in ChennaiAppium Training In ChennaiSoft Skills Training In ChennaiJMeter Training In ChennaiPower BI Training In ChennaiSocial Media Marketing Courses In ChennaiTalend Training in ChennaiHR Courses in ChennaiGoogle Cloud Training in ChennaiSQL Training In Chennai CCNP Training in Chennai PMP Training in Chennai OET Coaching Centre in Chennai
Are You Located in Any of these Areas
Adambakkam, Adyar, Akkarai, Alandur, Alapakkam, Alwarpet, Alwarthirunagar, Ambattur, Ambattur Industrial Estate, Aminjikarai, Anakaputhur, Anna Nagar, Anna Salai, Arumbakkam, Ashok Nagar, Avadi, Ayanavaram, Besant Nagar, Bharathi Nagar, Camp Road, Cenotaph Road, Central, Chetpet, Chintadripet, Chitlapakkam, Chengalpattu, Choolaimedu, Chromepet, CIT Nagar, ECR, Eechankaranai, Egattur, Egmore, Ekkatuthangal, Gerugambakkam, Gopalapuram, Guduvanchery, Guindy, Injambakkam, Irumbuliyur, Iyyappanthangal, Jafferkhanpet, Jalladianpet, Kanathur, Kanchipuram, Kandhanchavadi, Kandigai, Karapakkam, Kasturbai Nagar, Kattankulathur, Kattupakkam, Kazhipattur, Keelkattalai, Kelambakkam, Kilpauk, KK Nagar, Kodambakkam, Kolapakkam, Kolathur, Kottivakkam, Kotturpuram, Kovalam, Kovilambakkam, Kovilanchery, Koyambedu, Kumananchavadi, Kundrathur, Little Mount, Madambakkam, Madhavaram, Madipakkam, Maduravoyal, Mahabalipuram, Mambakkam, Manapakkam, Mandaveli, Mangadu, Mannivakkam, Maraimalai Nagar, Medavakkam, Meenambakkam, Mogappair, Moolakadai, Moulivakkam, Mount Road, MRC Nagar, Mudichur, Mugalivakkam, Muttukadu, Mylapore, Nandambakkam, Nandanam, Nanganallur, Nanmangalam, Narayanapuram, Navalur, Neelankarai, Nesapakkam, Nolambur, Nungambakkam, OMR, Oragadam, Ottiyambakkam, Padappai, Padi, Padur, Palavakkam, Pallavan Salai, Pallavaram, Pallikaranai, Pammal, Parangimalai, Paruthipattu, Pazhavanthangal, Perambur, Perumbakkam, Perungudi, Polichalur, Pondy Bazaar, Ponmar, Poonamallee, Porur, Pudupakkam, Pudupet, Purasaiwakkam, Puzhuthivakkam, RA Puram, Rajakilpakkam, Ramapuram, Red Hills, Royapettah, Saidapet, Saidapet East, Saligramam, Sanatorium, Santhome, Santhosapuram, Selaiyur, Sembakkam, Semmanjeri, Shenoy Nagar, Sholinganallur, Singaperumal Koil, Siruseri, Sithalapakkam, Srinivasa Nagar, St Thomas Mount, T Nagar, Tambaram, Tambaram East, Taramani, Teynampet, Thalambur, Thirumangalam, Thirumazhisai, Thiruneermalai, Thiruvallur, Thiruvanmiyur, Thiruverkadu, Thiruvottiyur, Thoraipakkam, Thousand Light, Tidel Park, Tiruvallur, Triplicane, TTK Road, Ullagaram, Urapakkam, Uthandi, Vadapalani, Vadapalani East, Valasaravakkam, Vallalar Nagar, Valluvar Kottam, Vanagaram, Vandalur, Vasanta Nagar, Velachery, Vengaivasal, Vepery, Vettuvankeni, Vijaya Nagar, Villivakkam, Virugambakkam, West Mambalam, West Saidapet
FITA Velachery or T Nagar or Thoraipakkam OMR or Anna Nagar or Tambaram or Porur or Pallikaranai branch is just few kilometre away from your location. If you need the best training in Chennai, driving a couple of extra kilometres is worth it!
© 2024 FITA. All rights Reserved.