The expertise of data scientists is essential for managing the vast datasets flowing from social media and e-commerce platforms. Most companies recognize data scientists as crucial for adopting Artificial Intelligence. This growing demand, coupled with the need for specific technical skills and toolsets, continues to drive millions of new job opportunities in data science and analytics.
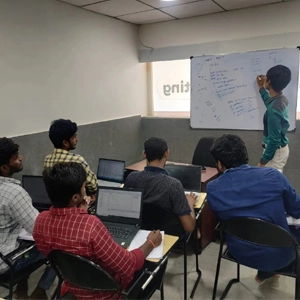
Recognizing the critical industry need, FITA Academy provides comprehensive training and placement support through its Data Science Course in Chennai. Our Corporate Training in Chennai equips students with the in-demand technical skills and toolsets vital for businesses.
The data scientist salary for freshers in India generally ranges from ₹4.5 Lakhs to ₹10 Lakhs per annum, depending on skills, certifications, location, and employer. With 4–5 years of experience, a skilled professional can easily command over ₹18 Lakhs annually.
The Data Science Course in Chennai, offered here at FITA Academy, provides knowledge and practical experience to face the competition in this field with competitive salaries. We encourage students to undertake practical projects and, with the guidance of like-minded professionals, succeed in the data science profession they aspire to.
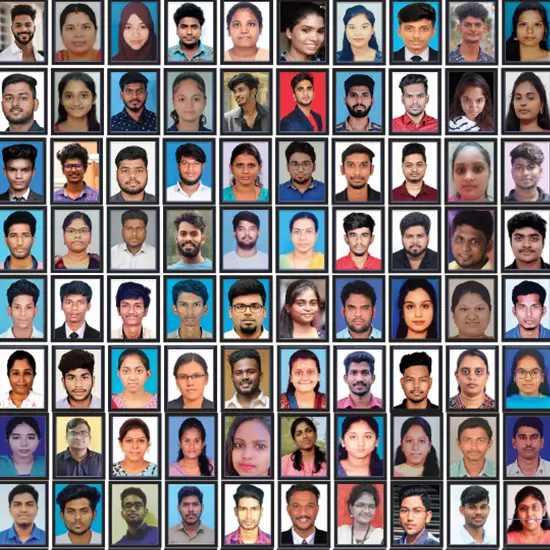
“Students are offered 100% placement training & assistance at the end of the course.”
Our 100% placement assistance program is designed around the concept of “Predictive Career Mapping.” Instead of simply sharing job leads, we analyze your strengths during the capstone projects to match you with specialized roles in high-growth sectors. We provide personalized mentorship from senior data architects who help you optimize your GitHub portfolio and refine your technical storytelling. This high-value professional guidance, combined with our network of over 3,000 hiring partners, ensures that our graduates enter the industry with a competitive advantage. This results in our students securing premium roles at leading MNCs such as Accenture and TCS, often with salary packages 40% above the industry baseline for freshers. We offer the best training support at a highly reasonable fee, ensuring that professional excellence is accessible to every dedicated learner.
What are the job opportunities for course completion?
A data science course in Chennai will open the doors to a stable career for individuals with analytical skills and a passion for deriving insights from data. Roles such as data analyst, machine learning engineer, data scientist, and business analyst involve data-driven decision-making and are in high demand within the industry. Foundational skills for analyzing and interpreting complex datasets are taught to professionals trained in key programming languages such as R, Python, and SQL.
Trainers at FITA Academy emphasize theoretical knowledge and practical skills, enabling students to learn effectively and be well-prepared for real-world challenges. The curriculum combines current tools and methods to test learners’ hands-on experience solving industry-related problems. It is essential to strike a balance between theory and practice to become an expert in the techniques of data visualisation, statistical modelling, and machine learning algorithms.
The demand for experienced professionals grows as organizations recognize the value of extracting actionable insights from data. Students can succeed in their chosen industries and contribute significantly to their organisations by mastering these qualities. This approach ensures readiness for the dynamic world of data science by bridging the gap between academic concepts and applied knowledge. For those aspiring to excel in the field, enrolling in a Data Science Course in Chennai with placement offers a strong foundation for career success.
Data Analyst: Data analysts are very important in organisations because they identify business issues and use data to answer questions and provide corrective measures. This role typically suits junior positions in Data Science, where individuals are trained on how to apply data and make informed decisions. Some of the assignments incumbent on the tacticians include cleaning, analysing, interpreting data, and displaying these findings through visualisations that are closely aligned with strategic ones. Knowledge of programming languages such as Python helps analysts handle large datasets, perform data mining, and produce actionable reports. However, Data Analysts contribute to a company’s growth across every aspect of its operations and decision-making processes by converting raw data into usable, comprehensible information.
Data Scientist: Data scientists leverage strong statistical skills and machine learning to perform predictive analytics, extract valuable insights from data, and solve critical business challenges. They identify patterns and forecast business trends by training models using supervised and unsupervised learning methods. Our Data Science and Artificial Intelligence courses in Chennai equip learners with the essential skills for real-world data management and model development. Through this program, students gain practical knowledge of statistical analysis, machine learning, and data visualization, all of which are crucial for making informed business decisions and understanding business intelligence.
Data Engineer: Data engineers support the development of optimal systems, enabling data scientists and analysts to perform their work effectively. A data engineer is responsible for ensuring data accuracy and preparing it for storage and use by consumers for data analytics, among other purposes. Their function will include ensuring that the data is properly acquired, preserved, and disseminated for other purposes, such as data mining for the users. A strong technical knowledge base is essential for creating and integrating APIs (application programming interfaces) and maintaining the data infrastructure, critical skills emphasized in data science classes in Chennai.
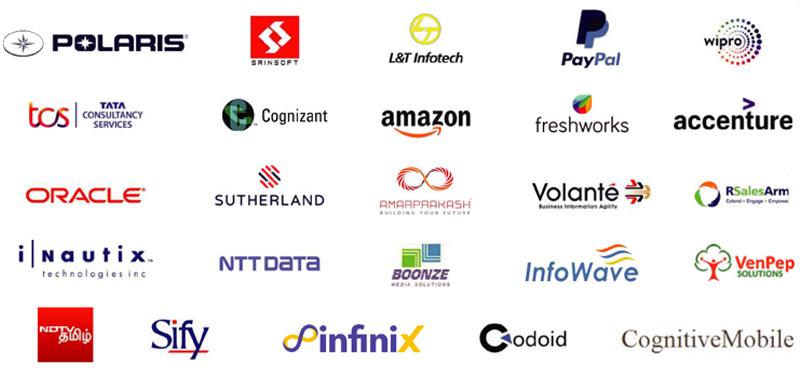
Leading Companies with the Highest Number of Analytics Job Vacancies
- Amazon
- Accenture
- KPMG
- Deloitte
- Honeywell
- Wells Fargo
- Ernst and Young
- eClerk Assistance
- Hexaware Tech Solutions
- Dell Global