
In statistical analysis, T-Tests are essential for comparing means between two groups. This blog offers a comprehensive overview of T-Tests, including testing definition, types, formulae, practical applications, and advanced approaches. So grab your cup while we spill you the tea about the T-Test.
What is a T-Test?
The T-Test, or Student’s T-Test, is a statistical hypothesis test used to determine if there is a significant difference between the means of two groups. It is often employed in research to compare the means of samples from different populations or treatments. The test is based on the t-distribution, which accounts for the smaller sample sizes typically encountered in research.
The fundamental principle behind the T-Test is to compare the difference between the sample means to the variability within the samples. If the difference between the means is large relative to the variability within the samples, it suggests that the difference is unlikely to have occurred by random chance alone.
There are several variations of the T-Test, each suited to different research scenarios:
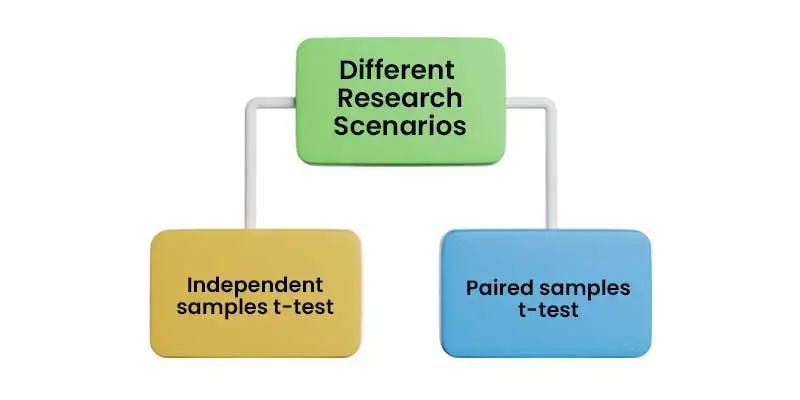
Independent samples T-Test
Used when comparing the means of two independent groups, such as testing the effectiveness of a new drug by comparing the outcomes for a treatment group and a control group. This test is crucial for testing definition in distinct experimental setups.
Paired samples T-Test
Also known as a dependent samples T-Test, used when the samples are not independent, such as when measuring the same group of subjects before and after an intervention. In this case, the differences between paired observations are analyzed. It’s a prime example of a t test example demonstrating pre-and-post intervention outcomes.
The T-Test produces a t-value compared to a critical value from the t-distribution. If the calculated t-value exceeds the critical value at a chosen significance level (often 0.05), then the null hypothesis (typically stating no difference between the groups) is rejected in favour of the alternative hypothesis, indicating a significant difference between the means. Understanding the T-Test formula is essential for computing and interpreting statistical outcomes.
At its essence, a T-Test enables researchers to ascertain whether there is a difference between the means of two samples relative to the variability within those samples and then compare this difference against the variability expected due to random chance alone. This analytical methodology finds widespread utility in hypothesis testing scenarios, where researchers aim to assess the efficacy of a treatment, intervention, or any other variable manipulation on a particular population. For those seeking to learn about the real-time application of T-Tests, considering enrolling in a Data Science Course in Chennai could provide valuable insights and practical knowledge.
Key Concepts and Terminology
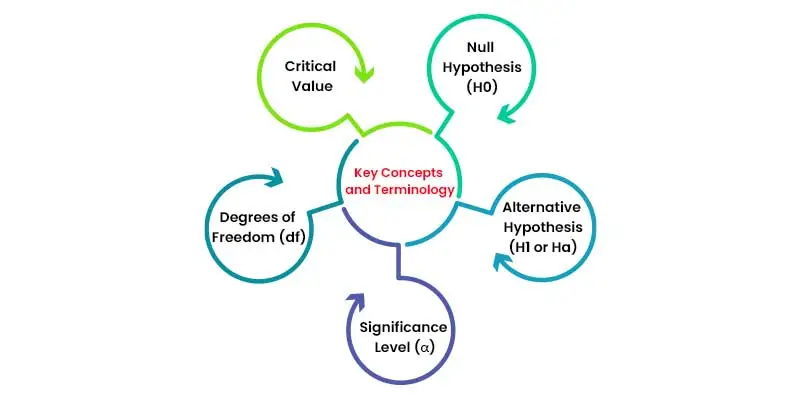
Null Hypothesis (H0)
- In hypothesis testing, the null hypothesis serves as the default assumption. It states that there is no significant difference between the groups being compared. Essentially, it assumes that any observed difference is due to random chance.
- The null hypothesis (H0) serves as the default assumption in hypothesis testing, asserting that there is no statistically significant difference among the groups compared, as commonly explored in discussions on types of T-Test.
- For example, in a drug trial, the null hypothesis might state that there is no difference in the drug’s effectiveness compared to a placebo.
Alternative Hypothesis (H1 or Ha)
- The alternate hypothesis opposes the null hypothesis. It suggests that there is a substantial difference between the groups being compared.
- Using the same drug trial example, the alternative hypothesis might state that the drug is more effective than the placebo or that there is a difference in effectiveness between the drug and placebo.
If you want to know more about the latest salary trends for Data Scienctist, Check out Data Scientist Salary For Freshers, which will help you get an insight into the packages as per the companies, skills and experience.
Significance Level (α)
- The significance level, often denoted as α, is the predetermined threshold at which the results of a statistical test are considered significant, often discussed as a fundamental aspect of the testing definition.
- Commonly set at 0.05, α indicates a 5% chance of observing the result due to random variation. In other words, if the chance of obtaining the observed result (or a more extreme outcome) under the null hypothesis is less than 5%, then the result is statistically significant.
- Researchers often choose the level of significance based on the desired balance of Type I and Type II errors.
- Understanding the nuances of significance levels and their implications for hypothesis testing is a fundamental aspect of statistical analysis, which can be further explored in a comprehensive Data Science Course in Bangalore.
Degrees of Freedom (df)
- Degrees of freedom refer to the no.of independent information available in the data sample. In the context of T-Tests, it is often related to the sample size and the number of groups being compared.
- In an independent sample T-Test, the degrees of freedom are calculated using the T-Test formula (n1 + n2 – 2), where the sample sizes of the two groups are denoted by n1 and n2.
- Degrees of freedom are crucial in determining the critical value and interpreting the statistical test results.
Critical Value
- The critical value is the threshold value used for determining whether the obtained test statistic falls within the critical region, leading to the rejection of the null hypothesis.
- It is based on the chosen significance level and the distribution among various types of T-Test statistics (e.g., t-distribution for T-Tests, z-distribution for z-tests).
- If the computed test statistic outclass the critical value, the null hypothesis is usually rejected in favor of the alternative hypothesis, implying that the observed difference is statistically significant.
T-Test Formula and Calculation
The T-Test statistic is calculated differently depending on whether the samples being compared are dependent (paired) or independent. For independent samples, the T-Test formula for the statistic is:
t = (x̄₁ – x̄₂) / √((s₁² / n₁) + (s₂² / n₂))
Where:
x̄₁, x̄₂ = sample means of the two groups
s₁², s₂² = sample variances of the two groups
n₁, n₂ = sample sizes of the two groups
For dependent (paired samples), the T-Test formula is slightly different and is based on the differences between paired observations:
t = 𝑥̄𝑑 / (𝑠𝑑 / √𝑛)
Where:
– 𝑥̄𝑑 is the mean of the paired differences,
– 𝑠𝑑 is the standard deviation among the paired differences,
– 𝑛 is the number of pairs.
Types of T-test
While the fundamental understanding of T-Tests involves comparing means between two groups, several advanced applications and extensions of T-Tests cater to different research scenarios, contributing to a comprehensive understanding of the testing definition.
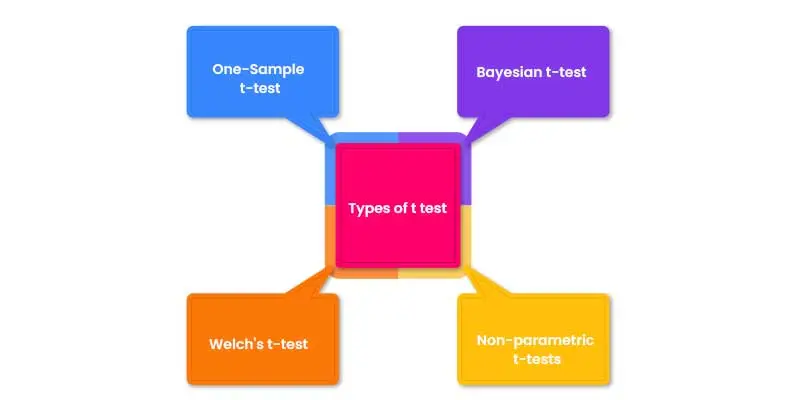
One-Sample T-Test
This analytical tool determines whether the mean of a single sample significantly deviates from a known population mean. Researchers utilize this method to evaluate whether observed data significantly diverges from a pre-established benchmark, providing insights into the characteristics of a specific sample population. This is particularly useful in testing definition scenarios where researchers seek to validate assumptions or hypotheses about a population parameter.
Welch’s T-Test
Welch’s T-Test, which modifies the independent T-Test, is valuable in scenarios where assumptions of equal variances between groups may not hold true. By relaxing this assumption, Welch’s T-Test offers a more robust approach for analyzing group differences, ensuring accurate interpretation even in cases of unequal variance. The T-Test formula for Welch’s T-Test adjusts for unequal variances, providing reliable results.
Bayesian T-Test
The Bayesian T-Test, on the other hand, applies the ideas of Bayesian inference to hypothesis testing in contrast to conventional frequentist methods. This methodology offers a more nuanced interpretation of results, particularly beneficial in situations with limited sample sizes or complex data structures. The Bayesian T-Test provides researchers with more informative and contextually rich outcomes by leveraging prior knowledge and updating beliefs based on observed data.
Non-parametric T-Tests
When traditional T-Tests encounter violations of assumptions regarding normality and homogeneity of variance, non-parametric T-Tests emerge as viable alternatives. These tests, including the Mann-Whitney U test or Wilcoxon signed-rank test, represent types of T-Test that rely on fewer distributional assumptions, making them robust for analyzing data with non-normal distributions or unequal variances. Non-parametric T-Tests offer researchers flexibility and reliability in exploring group differences across diverse research contexts.
When and How to Use Each Type of T-Test?
T-Tests are fundamental statistical tools used to compare means between two groups. Understanding when and how to use each type of T-Test is essential for practical statistical analysis. Whether comparing means before and after an intervention, between two unrelated groups, or within paired observations, T-Tests offer valuable insights into differences or associations within the data.
T-Tests are commonly used in statistical analysis, and Python, a versatile programming language, offers various libraries and modules that facilitate T-Test computations and analysis. Libraries such as SciPy, StatsModels, and NumPy provide functions and methods for conducting T-Tests, calculating p-values, and interpreting results. Additionally, Python’s data manipulation libraries, like Pandas, are often used to preprocess and organize data before conducting T-Tests.
Thus, Python is a powerful tool for performing different types of T-Test and analyzing their results in data science and statistical research projects. Students seeking to improve their Python skills can benefit from comprehensive Python Training in Chennai offered by FITA Academy, which covers advanced topics, including T-Test applications in statistical analysis.
Assumptions Underlying T-Tests
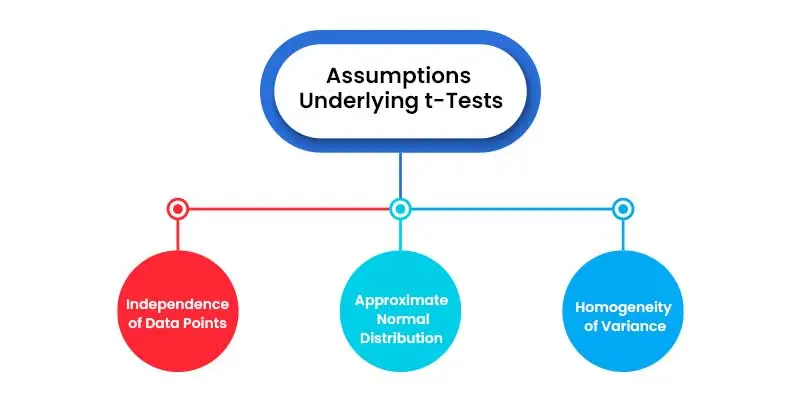
For T-Tests to yield accurate results, certain assumptions must be met to ensure validity and reliability. These include:
Independence of Data Points
Each observation should be independent of others. In paired T-Tests, observations within each pair are independent, while in independent T-Tests, observations in one group should not influence observations in the other group. This fundamental principle is essential for preserving the integrity of the analysis, regardless of whether it involves assessing what is T-Test or conducting more complex statistical comparisons.
Approximate Normal Distribution
The distribution of the data should approximate a normal distribution. While T-Tests are robust to violations of normality for large sample sizes, it’s essential to assess whether the data distribution is reasonably close to normal.
Homogeneity of Variance
The variance within groups should be approximately equal. This assumption is critical for independent T-Tests but less relevant for paired T-Tests.
Choosing The Right Types of T-Tests for Targeted Analysis
Just like there’s a perfect tea for every mood (calming chamomile, invigorating green tea), there’s a specific type of T-Test best suited for your research question. Selecting the appropriate type of T-Test hinges on several factors, including the nature of the data and the research question. Researchers must decide between one-sample, two-sample, or paired T-Tests based on the design of their study and the specific hypotheses being tested.
- One-Sample T-Test: Used when comparing a sample mean to a known or hypothesized population mean.
- Two-Sample T-Test: Appropriate for comparing means between two independent groups.
- Paired T-Test: Suitable for comparing means of two related groups or conditions, where each subject or entity is measured twice (before and after treatment, for example).
Understanding the nuances of each T-Test type allows researchers to tailor their analysis to the specific hypotheses being tested. Ready to test your T-Test skills and hone them to a razor’s edge? Consider enrolling in a Python Course in Coimbatore.
Understanding T-Test formula and Performing T-Test using Software Tools
The essence of a T-Test lies in estimating the actual difference between group means through a systematic analysis of sample data. This process involves applying the T-Test formula, which calculates the t-value based on the mean difference and the standard error of the groups.
Interpreting T-Test Results: Deciphering Statistical Significance
Interpreting T-Test results involves assessing the statistical significance of observed differences between groups. Key metrics include:
- t-value: indicates the magnitude of the difference between group means.
- P-value: represents the probability of observing such a large (or more significant) difference between groups if the null hypothesis were true.
- Degrees of Freedom This influences the shape of the t-distribution and is crucial for determining the critical t-value
Practical Applications of T-Tests
T-Tests find widespread application across various fields, including biology, psychology, economics, and beyond. Real-world examples demonstrate what is T-Test, how T-Tests are used to compare treatment outcomes, evaluate program effectiveness, analyze survey data, and more. By applying T-Tests to practical scenarios, researchers gain valuable insights into group differences and treatment effects, informing decision-making and policy development.
Beyond basic comparisons of means, advanced T-Test techniques allow researchers to uncover intricate relationships within the data. These techniques may involve:
- Multiple Comparisons: Factor for the increased risk of Type I errors when conducting multiple comparisons.
- Analysis of Covariance (ANCOVA): Incorporating additional covariates to improve the precision of estimates and account for confounding variables.
- Repeated Measures ANOVA: Extending the analysis to compare means across multiple time points or conditions within the same subjects.
By leveraging these advanced applications, researchers gain deeper insights into complex phenomena and enhance the robustness of their statistical analyses, a crucial skill emphasized in our comprehensive Data Analytics Course in Chennai.
In conclusion, T-Tests are indispensable statistical analysis tools, enabling rigorous data analysis in data science and hypothesis testing across various domains and drawing meaningful conclusions from their data. By understanding the fundamental concepts, T-Test formula, and advanced applications of T-Tests, researchers can wield this powerful statistical technique effectively in a wide range of research settings, from clinical trials to social science experiments and beyond.
