
In the contemporary era characterized by abundant data, the ability to comprehend and extract meaningful insights from digital information is a key driver of success for businesses. Despite the vast volume of data generated daily, a mere 0.5% undergoes analysis and is utilized for purposes such as data discovery, enhancement, and intelligence. While this percentage might seem modest in relation to the overall volume, it still represents a substantial amount of valuable data.
Scientifically, data analysis employs sophisticated techniques to explore and experiment with data. In a business context, however, data serves as the foundation for making informed, data-driven decisions aimed at enhancing overall organizational performance. This discussion focuses on the analysis of data from an organizational standpoint, delving into the scientific and statistical principles essential for grasping the fundamentals of data analysis.
To provide a comprehensive understanding, various crucial analytical questions will be addressed, and diverse methods and techniques will be explored. The practical aspect of data analysis will be demonstrated through a 10-step blueprint for success, showcasing how to effectively perform analysis in real-world scenarios. For individuals keen on gaining hands-on experience and practical insights into data analysis, considering enrolling in a reputable Data Analytics Course in Chennai can be a valuable step. This educational opportunity will equip individuals with the knowledge and skills to apply analytical methods in real-world situations, contributing to their success in the field of data analysis.
What is Data Analysis?
Data analysis is a multifaceted process involving the collection, modeling, and examination of data through diverse statistical and logical methods and techniques. Businesses heavily depend on analytical processes and tools to extract valuable insights that inform strategic and operational decision-making.
The methodologies employed in data analysis predominantly fall into two core areas: quantitative and qualitative research. Quantitative research involves the numerical representation and statistical interpretation of data, enabling the extraction of measurable insights. On the other hand, qualitative research focuses on non-numeric data, emphasizing the exploration of underlying patterns, meanings, and contexts within the information. Together, these two approaches contribute to a comprehensive understanding of data, empowering organizations to make informed and effective decisions.
Enhancing your comprehension of various techniques in both quantitative research and qualitative insights provides a well-defined direction for your analytical efforts, making it worthwhile to invest time in absorbing this knowledge.
Beyond the qualitative and quantitative categories, it’s essential to be aware of other data types before delving into complex analysis processes. These include:
Big data: Encompassing massive datasets that require advanced software for analysis, big data unveils patterns and trends. It stands as a significant analytical asset, offering larger volumes of data at an accelerated rate.
Metadata: Acting as information about other data, metadata provides key insights summarizing specific data. It facilitates ease of finding and reusing data for subsequent purposes.
Real-time data: As the name suggests, real-time data is presented immediately upon acquisition. From an organizational standpoint, it is highly valuable, aiding in crucial decision-making based on the latest developments.
Machine data: This complex data is generated solely by machines, such as phones, computers, websites, and embedded systems, without prior human interaction. Understanding these diverse data categories enriches the analytical process and equips organizations to make well-informed decisions.
Why is Data Analysis Important?
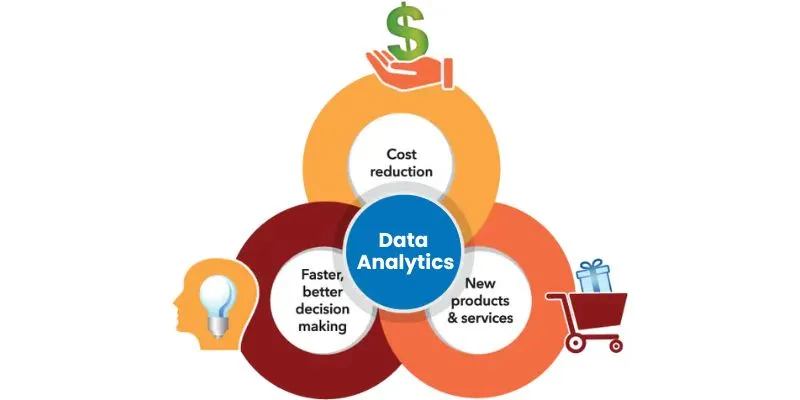
Analyzing data offers substantial potential for organizations, contributing to various aspects of business operations and decision-making:
Informed Decision-Making: Data analysis empowers management with factual insights, enabling informed decision-making. This spans areas such as capital investment, identification of growth opportunities, income prediction, and proactive management of potential challenges. Utilizing dashboard software enhances the presentation of data to diverse stakeholders in a professional and interactive manner.
Cost Reduction: Employing advanced technologies like predictive analytics allows businesses to identify improvement opportunities, trends, and patterns in their data. This strategic planning based on data analysis helps in cost reduction by avoiding the implementation of ineffective strategies. Predicting scenarios, such as sales and demand, also facilitates anticipating production and supply needs.
Targeting Customers Effectively: Customers play a pivotal role in any business, and analytics provides a comprehensive understanding of various aspects related to them. This includes channels of communication, demographics, interests, habits, purchasing behaviors, and more. Such insights drive success in marketing strategies, aid in identifying new potential customers, and prevent resource wastage on targeting the wrong audience or conveying inaccurate messages. Additionally, customer satisfaction can be monitored by analyzing client reviews or assessing the performance of the customer service department.
What is the Data Analysis Process?
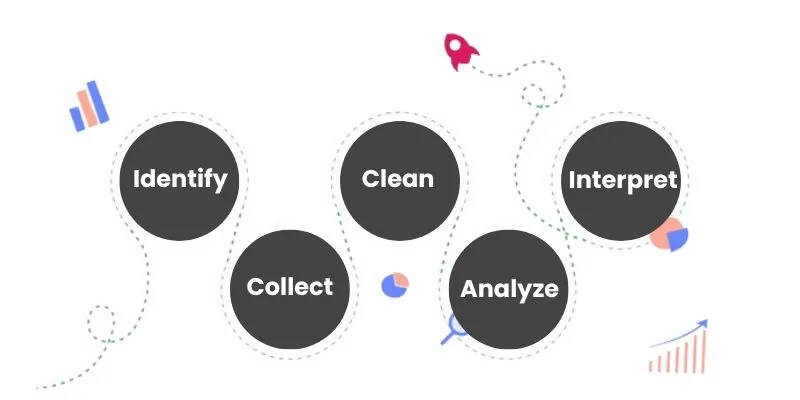
Analyzing data is a systematic process involving five crucial stages:
Identify: The initial stage involves defining the questions you aim to answer with the data. For instance, understanding customer perceptions or determining engaging packaging types are identified questions that set the foundation for the analysis.
Collect: Following identification, the collection of data begins. This stage involves deciding on data sources and methods, such as internal or external sources, surveys, interviews, questionnaires, or focus groups. The data collection approach differs between quantitative and qualitative scenarios.
Clean: Once the necessary data is gathered, it undergoes a cleaning process to ensure its readiness for analysis. This involves removing duplicate records, erasing white spaces, and addressing formatting errors. High-quality data is essential to prevent inaccuracies in subsequent analyses.
Analyze: Employing various techniques like statistical analysis, regressions, neural networks, and text analysis, the collected data is analyzed to extract trends, correlations, variations, and patterns. Technologies such as business intelligence software, predictive analytics, and data mining support researchers and users during this stage.
Interpret: The final stage involves interpreting the results of the analysis. Researchers formulate courses of action based on their findings. For instance, understanding customer preferences for specific packaging attributes. Additionally, this stage helps identify any limitations in the analysis that may require further attention. For those interested in delving deeper into the field of data science and mastering the skills needed for effective analysis and interpretation, considering enrolling in a reputable Data Science Course in Coimbatore can be a valuable step. This educational opportunity equips individuals with the knowledge and tools to navigate complex data landscapes, interpret results effectively, and contribute to the success of data-driven decision-making processes.
These five stages provide a structured framework for effective data analysis. Now, let’s delve into the top 10 essential methods that complement this process.
Essential Types Of Data Analysis Methods
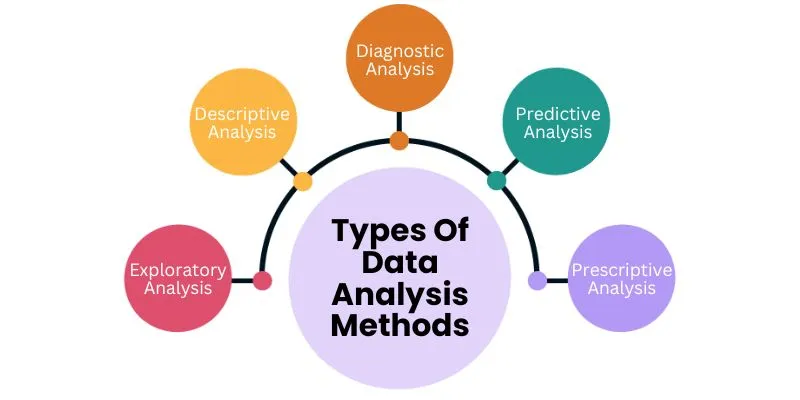
Understanding different categories of data analysis is crucial for organizations aiming to extract meaningful insights. The analysis journey spans from descriptive to prescriptive methods, with each category adding complexity and value:
Descriptive Analysis
Descriptive analysis focuses on organizing, manipulating, and interpreting raw data to answer the question, “What happened?” It transforms data into valuable insights, providing a foundation for further investigations. While it doesn’t predict or explain why something occurred, it ensures data is organized for meaningful presentations.
Exploratory Analysis
Exploratory analysis aims to explore data relationships. It is employed before any understanding of the relationships between variables exists. This method helps discover connections, generate hypotheses, and find solutions for specific problems, often applied in areas like data mining.
Diagnostic Analysis
Diagnostic analysis seeks to understand why something happened. It provides analysts and executives with contextual insights, enabling them to address challenges or issues effectively. This method offers actionable answers to specific questions, contributing to essential organizational functions such as retail analytics.
Predictive Analysis
Predictive analysis looks into the future to answer the question, “What will happen?” It utilizes results from descriptive, exploratory, and diagnostic analyses, along with machine learning and artificial intelligence. Predictive analysis uncovers future trends, potential problems, and connections in data, allowing organizations to develop informed initiatives.
Prescriptive Analysis
Prescriptive analysis complements predictive analysis by using patterns or trends to develop responsive business strategies. It involves actively using visual data sets to address emerging issues in various areas, including marketing, sales, customer experience, HR, finance, and logistics analytics.
These analysis categories provide organizations with a comprehensive approach to extracting insights and developing informed strategies for improved decision-making.
Data Analysis Limitations & Barriers
Analysing data is a complex task that comes with several challenges, each requiring careful consideration to ensure meaningful insights. Here are some key barriers that researchers may encounter during the analysis process:
- Lack of Clear Goals
Conducting data analysis without clear goals or hypotheses diminishes its value. In a business context, where strategic decisions hinge on data, the absence of specific guidelines can render the analytical process directionless and potentially futile. Establishing precise objectives ensures that the analysis is purposeful and contributes meaningfully to organizational goals.
- Objectivity
Objectivity in data analysis is a persistent challenge. Researchers may unconsciously steer results toward preconceived expectations. Regularly scrutinizing assumptions and seeking external input are vital strategies to counteract biases and maintain an unbiased analytical perspective.
- Data Representation
Choosing the right method for data representation is critical. Inappropriate visualizations can mislead audiences and compromise the credibility of the analysis. Understanding the suitability of different types of data representation in varying contexts is crucial for effective communication.
- Flawed Correlation
Mistaking correlation for causation is a common pitfall that can lead to inaccurate interpretations. Distinguishing and avoiding flawed correlations is essential to prevent misguided strategic decisions based on spurious connections between variables.
- Sample Size
The reliability of analytical results is directly tied to the sample size. Small samples may not accurately represent the population, undermining the trustworthiness of conclusions drawn from the analysis. Ensuring an appropriately sized sample is fundamental to the validity of analytical outcomes.
- Privacy Concerns
Mishandling data can raise privacy concerns and breach regulations. Safeguarding sensitive information through anonymization and limiting data collection to essential elements helps protect customer privacy and maintain trust. Adhering to ethical data practices is paramount to avoid reputational damage.
- Lack of Communication Between Teams
In a business environment, disparate departmental goals can hinder cohesive strategy development. Poor communication between teams impedes the collaborative process. Data dashboards and collaborative tools that facilitate visual data representation can enhance communication, fostering a shared understanding and synergy among different departments.
- Innumeracy
Despite the prevalence of business intelligence tools, not all employees possess the skills needed for effective data analysis. Overcoming innumeracy requires the implementation of training programs to enhance data literacy across the organization. Ensuring that all relevant personnel can derive meaningful insights from data is crucial for maximizing the utility of analytical efforts.
Data Analysis Skills
As this extensive book has taught you, analysing data is a difficult undertaking that calls for a wide range of expertise. Nevertheless, the process is far more accessible and flexible now than it was before because of the growth of self-service technologies. Nevertheless, there are still a few essential abilities that are helpful to have when handling data; we’ve enumerated the most crucial ones below.
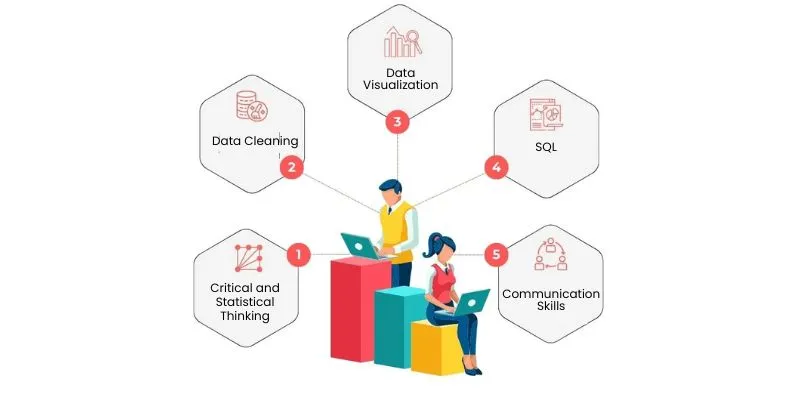
- Critical and Statistical Thinking
Analyzing data requires creative and critical thinking to uncover connections, form valuable hypotheses, and draw insightful conclusions. Statistical thinking and a solid understanding of numbers complement critical thinking, enabling analysts to delve beyond surface-level observations.
- Data Cleaning
Data cleaning and preparation constitute a substantial portion of a data analyst’s work. Neglecting proper data cleaning can compromise analysis accuracy, leading to flawed conclusions. Mastery of data cleaning skills, even in the era of automated tools, remains fundamental for effective data analysis.
- Data Visualization
The ability to create meaningful visual representations of data is crucial. Proficiency in choosing appropriate chart types, applying them correctly, and designing visually compelling graphics enhances both professional and non-technical users’ understanding of complex information, streamlining the data exploration process.
- SQL (Structured Query Language)
SQL proficiency is foundational for data analysts. As a programming language used to interact with databases, SQL enables the manipulation, updating, and organization of data within relational databases—commonly employed by businesses. This skill is both valuable and relatively easy to acquire.
- Communication Skills
Effective communication is paramount in a business environment. Data analysts must convey complex analytical outcomes clearly to colleagues, including non-technical stakeholders. This skill extends to both verbal and written communication, whether presenting findings in person or creating dashboards and reports for broader dissemination. While considered a “soft” skill, communication is integral to sharing analytical insights effectively.
Data Analysis in the Big Data Environment
Big data is an invaluable asset for contemporary businesses, offering transformative insights when analyzed using various data analysis methods. To underscore the significance of big data, consider the following insights:
- Projected Industry Worth
By 2026, the big data industry is anticipated to reach a staggering worth of approximately $273.4 billion, reflecting its central role in shaping the business landscape.
- Crucial for Growth and Transformation
A substantial 94% of enterprises acknowledge the importance of data analysis for their growth and digital transformation. This recognition underscores the pivotal role data plays in driving organizational evolution.
- Impact on Operating Margins
Businesses that effectively harness the full potential of their data stand to gain significantly. Companies maximizing data utilization can witness an impressive increase of up to 60% in their operating margins, emphasizing the tangible financial benefits.
- Financial Impact of Artificial Intelligence
The financial impact of Artificial Intelligence (AI) is poised for substantial growth. By 2025, the AI industry is expected to contribute up to $40 billion, highlighting the escalating influence of AI technologies in various sectors.
Embracing sound data analysis methodologies, including concepts related to big data, empowers businesses to streamline operations, foster cohesion, gain insightful perspectives, and ultimately achieve unprecedented success. For those eager to master the art of data analysis and delve into the world of big data, considering enrolling in reputable Data Analytics Courses in Bangalore can provide valuable insights and skills. This educational opportunity equips individuals with the knowledge to navigate complex data landscapes, utilize analytics tools effectively, and contribute to the success of businesses in the dynamic field of data analysis.
Key Takeaways From Data Analysis
In concluding our exploration of data analysis, here’s a concise summary of ten essential types of data analysis methods that can significantly contribute to business growth:
- Cluster Analysis
Grouping data elements based on similarities to identify hidden patterns and enhance targeted efforts.
- Cohort Analysis
Examining and comparing behavior segments in historical data, offering insights for targeted strategies.
- Regression Analysis
Utilizing historical data to understand how a dependent variable is influenced by changes in independent variables.
- Factor Analysis
Reducing variability among correlated variables by identifying unobserved factors, and streamlining specific segments.
- Neural Networks
Powering intelligent algorithms through machine learning, enabling data-driven insights and predictions.
- Data Mining
Extracting valuable knowledge by identifying patterns, dependencies, and trends through exploratory statistical evaluation.
- Text Analysis
Analyzing text data to derive insights, sentiments, and patterns, contributing to informed decision-making.
- Time Series Analysis
Examining data points over time to understand trends, dependencies, and forecast future events.
- Decision Trees
Visualizing potential outcomes, consequences, and costs in a tree-like model to facilitate strategic decision-making.
- Conjoint Analysis
Survey-based method to understand individual preferences and optimize product or service attributes.
Diverse methods like statistical analysis, machine learning, and predictive modeling create a robust toolkit for data-driven decision-making. Enroll in a Python Course in Pondicherry to master essential skills for sustainable growth.
Data Analysis Techniques
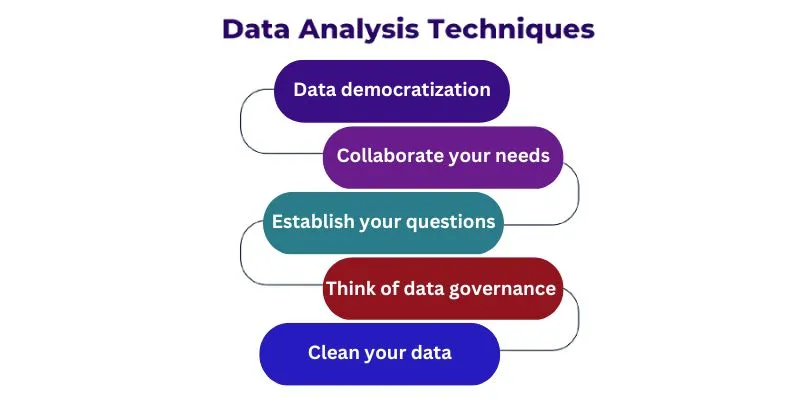
- Collaborate Your Needs
Foster collaboration among stakeholders to understand their data needs and perspectives.
- Establish Your Questions
Clearly define the questions or problems you want to address through data analysis.
- Data Democratization
Ensure that data is accessible and understandable by a broad audience within the organization.
- Think of Data Governance
Implement robust data governance practices to maintain data quality, integrity, and security.
- Clean Your Data
Prioritize data cleaning to eliminate errors, duplicates, and inconsistencies for accurate analysis.
- Set Your KPIs
Define Key Performance Indicators (KPIs) that align with your business goals and objectives.
- Omit Useless Data
Focus on relevant data and omit unnecessary information to streamline analysis processes.
- Build a Data Management Roadmap
Develop a comprehensive plan for managing data throughout its lifecycle.
- Integrate Technology
Leverage advanced technologies and tools to enhance data analysis efficiency and accuracy.
- Answer Your Questions
Use data analysis to provide meaningful answers to your initial questions, driving actionable insights.
By incorporating these techniques, businesses can establish a structured and effective approach to data analysis, ensuring valuable insights and informed decision-making. For those eager to delve deeper into the realm of data analysis and visualization, considering enrolling in a reputable Power BI Training in Chennai can provide valuable insights and skills. This educational opportunity equips individuals with the knowledge to leverage Power BI effectively, empowering them to extract meaningful insights from data and enhance decision-making processes.
