This Blog is enough to get you started for hand ons with numpy, because it covers
What is Numpy
Getting started is Numpy
Arrays in numpy
Operations with numpy
Statistics with Numpy
Estimate Mean ,Median and Percentile Using Numpy
Estimate Standard Deviation and Variance Using Numpy
Random Data Distribution with Numpy and Matplotlib
What Is Numpy?
Numpy or Numerical python is a free and open source library for working with n-dimensional arrays or ndarrays.It is often used with other libraries such as scipy,matplotlib,Pandas,scikit for scientific computations for various data science or machine learning applications.Numpy is partly written in Python and the rest with C C++.
Getting Started With Numpy
Numpy does not come pre installed with python.So you will need to install it with either pip or pipenv installed on your system, then the following command is enough to get started with numpy
Or if you are using any python distribution like Anaconda, Spyder etc., then they have numpy pre installed and you can just start from importing numpy in your environment.
Throughout the blog i will use an alias name np for numpy,so i will import it in this way,
Arrays In Numpy
The number lists passed to the array function is the number or rows and the number of elements in the list is the number of columnsThe numpy.array() function takes an optional argument as dtype,which you can use to define the data type of the elements of the array,by default the dtype will be set to the data type of the elements guessed by the numpy.For example
To create an arbitrary array, use numpy.array()
| n = np.array([[1, 2, 3], [1, 3, 4]])
print(n) |
This is an array with 2×3 dimension or with 2 rows and 3 columns.
Output
To create an array filled with 0s use numpy.zeros()
Here the (2,2) specifies the dimension or 2 rows and 2 columns.
Output
To create an array filled with 1s use numpy.ones()
Output
To create nxn array filled with a given number use numpy.fill()
Output
To create an identity matrix use numpy.eye()
Output
| [[1. 0. 0.]
[0. 1. 0.]
[0. 0. 1.]] |
Python Lists Vs Numpy Arrays
In python we used lists for storing multiple data instead of arrays, because arrays can only include homogenous data or elements of the same data type.Then why use arrays instead of lists?
Array elements are stored at contiguous memory locations,and use less memory and space which make them convenient to use.
Consider the following example where we are adding numbers,(1 to 100000 with 1 to 100000) with lists and arrays and comparing their time difference (with time module) to do this math.
| import time
import numpy as np
vector = 100000
def pure_python_ver():
t = time.time()
x = range(vector)
y = range(vector)
z = [x[i] + y[i] for i in range(len(y))]
return time.time() – t
def numpy_ver():
t = time.time()
x = np.arange(vector)
y = np.arange(vector)
z = x + y
return time.time() – t
t1 = pure_python_ver()
t2 = numpy_ver()
print(‘time taken by python version:’,t1)
print(‘time taken by numpy version: ‘, t2)
print(“Numpy is” + str(t1/t2) + ” faster!”) |
Output
| time taken by python version: 0.19698405265808105
time taken by python version: 0.0011696815490722656
Numpy is in this example 168.40827558092133 faster! |
Check outthis Online Python Course by Fita, which includes Supervised,Unsupervised machine learning algorithms,Data Analysis Manipulation and visualisation,reinforcement testing, hypothesis testing and much more to make an industry required data scientist at an affordable price, which includes certification, support with career guidance assistance.
Array Indexing
Accessing an array element from 1-D array
| arr = np.array([1, 2,3, 5, 11])
print(arr[2],arr[3]) # outputs: 3 5 |
Accessing elements from 2-D array
| arr = np.array([[1,2,3],[6,7,8]])
print(‘3rd element from row 1: ‘, arr[0,2]) # outputs 3 |
where the first index passed is row number and the second is the column number
.
Accessing elements from 3-D array
| arr = np.array([[[0, 1, 1], [3, 3, 4]], [[4, 4, 5], [3, 3, 5]]])
print(arr[0][1][2]) #outputs 6
print(arr[0, 1, 2]) # outputs 6 |
Consider this to understand why the above code outputs 6
| print(arr)
print(arr[0])
print(arr[0][1])
print(arr[0][1][2]) |
Output
| [[[0 1 1]
[3 3 4]]
[[4 4 5]
[3 3 5]]]
[[0 1 1]
[3 3 4]]
[3 3 4]
4 |
Slicing Elements from the array
We’ll have the same slicing method as the list that is using indexing or [start:end:step].
| arr = np.array([1, 3, 5, 7, 11, 13, 17])
print(arr[1:7:2]) #output: [ 3 7 13] |
The above program returns every element from index 1 to index 7 by skipping 2 elements in between.
We will have to specify the slicing for both the rows and column, separated by a comma respectively.
| arr = np.array([[1, 1, 2, 3, 5], [1, 2, 3, 5, 7]])
print(arr[1, 2:5]) # outputs [3 5 7] |
Here the program slices for row 1 and for the columns of the respective row 1 it gives values from index 2 to index 5.
Another example for slicing 2-D arrays
| arr = np.array([[1, 1, 2, 3, 5],
[1, 2, 3, 5, 7]])
print(arr[0:2, 2:4]) |
Here we are taking rows from 0 to 1(2 excluded because of colon) and printing values from index 2 to index 3 (4 excluded because of colon).
Output
Other Numpy operations
The shape returns the size of each dimension.
| arr = np.array([[1, 1, 2, 3, 5],
[1, 2, 3, 5, 7],
[1, 2, 3, 4, 5]])
print(arr.shape) # output: (3, 5) |
The reshape will change the shape of the array, most often you will see a -1 passed as the second argument, this is to let the numpy decide the shape of the respective dimension of the position.
| arr = np.array([1, 1, 2, 3, 5, 8, 13, 21])
newarr_1 = arr.reshape(-1, 2) # unknown value passed for row
newarr_2 = arr.reshape(2, -1) # unknown value passed for column
print(newarr_1)
print()
print(newarr_2) |
Output
| [[ 1 1]
[ 2 3]
[ 5 8]
[13 21]]
[[ 1 1]
[ 2 3]
[ 5 8]
[13 21]] |
The ravel will convert an array with any dimensions into a 1-D array or array with one column,but with a view copy.
| arr = np.array([[1, 2], [3, 4], [5, 6]])
new_arr = arr.ravel()
print(new_arr) |
The flatten will also convert an array with any dimensions into a 1-D array or array with one column,but with a copy.
Copy And View In Numpy
The difference between view and copy of an array is that the former one(view) will create a new array with the elements as of the parents elements,but changing any of the elements of either the parent’s or the view copy’s element will be reflected in both the arrays.Whereas the later one(copy) is like deep copy of lists, where changing elements of either the parents or the copied array will not change the other one.
Math operations on arrays
Doing addition, multiplication division or finding the square root is just as you would do in python with 2 or more operators.I will implement all these operations in the program below.
Consider the following example for converting a list of temperatures in celsius to fahrenheit and converting an array of temperatures in Celsius to Fahrenheit.
| cel_list = [20.2, 20.4, 22.9, 21.5, 23.7, 25.3, 21.8, 24.2, 20.9, 22.1]
cel_arr = np.array(cel_list)
# or create with this
# cel_arr = np.array([20.2,20.4,22.9, 21.5,23.7, 25.3,21.8,24.2,20.9, 22.1])
print(cel_arr)
# output: [20.2 20.4 22.9 21.5 23.7 25.3 21.8 24.2 20.9 22.1] |
Converting celsius to fahrenheit
For lists this can be done by looping over each value with list comprehension and performing the operation.
| f_list = [ x*(9/5) + 32 for x in cel_list]
print(f_list)
# output
# [68.36, 68.72, 73.22, 70.7, 74.66, 77.53999999999999, 71.24000000000001, 75.56, 69.62, 71.78] |
For arrays this can be done with scalar multiplication as follows
| feh_arr = cel_arr * (9 / 5) + 32
print(feh_arr)
# Output: [68.36 68.72 73.22 70.7 74.66 77.54 71.24 75.56 69.62 71.78] |
Statistics with Numpy
The mean of a data set is the average value or the sum of values divided by the number of values.We can calculate the mean of any data set with numpy.mean().
Now let us find the average value of the speed of the given 10 people.
| speed = [91, 20, 81, 86, 120, 86, 91, 122, 91, 78]
x = np.mean(speed)
print(x) # output: 86.6 |
Estimate median with numpy
Median is the middle most value of the given values, after arranged in ascending or descending order,we can calculate the median of any data set with numpy.median().
Now let’s calculate the middle most value(where all the values surround) for those 10 people’s speed.
| speed = [91, 20, 81, 86, 120, 86, 91, 122, 91, 78]
x = np.median(speed)
print(x) # output: 88.5 |
Estimate Percentile with numpy
A Percentile shows the percentage of the values that are less than the given value,we can calculate percentile with numpy.percentile().
Now let us calculate the speed where the percentage of speed is 50 or less than that.
| speed = [91, 20, 81, 86, 120, 86, 91, 122, 91, 78]
x = np.percentile(speed, 34)
print(x) # output: 86.0 |
The mode of the data set can be calculated with the scipy library of python.
Estimate standard deviation with numpy
The standard deviation indicates how far the values are from the mean or the sum of the difference of the value from the mean, we can calculate the standard deviation with numpy.std()
Now lets calculate the standard deviation of the speeds registered.
| speed = [91, 20, 81, 86, 120, 86, 91, 122, 91, 78]
x = np.std(speed)
print(x) # output: 26.3977271748914 |
Estimate variance with numpy
Variance is the square root of the standard deviation.We can estimate the variance using numpy.var().
Now calculate how far the values are from the mean and every other value.
| speed = [91, 20, 81, 86, 120, 86, 91, 122, 91, 78]
x = np.var(speed)
print(x) # output: 696.8399999999999 |
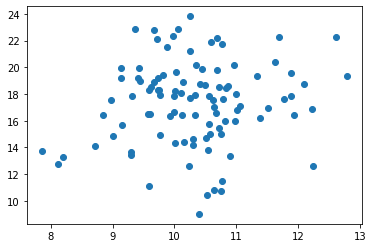
Random Data Distribution With Numpy and Matplotlib
Let us create 2 arrays with random values and specified mean and variance.
| import numpy as np
set_1 = np.random.normal(10.0,1.0,100)
set_2 = np.random.normal(17.0,2.5,100) |
Here the first array will have 100 random values, with a mean of 10.0 and variance of 1.0.
The second array has 100 random values, with a mean of 17.0 and variance of 1.5.
Now we will use matplotlib library to plot this data as a scatter diagram.
| import matplotlib.pyplot as plt
%matplotlib inline #to prevent opening of new window for showing diagram
plt.scatter(set_1,set_2)
plt.show() |
We can observe that the values are concentrated more around the 10 (mean of x) on the x-axis and near 17 (mean of y) on the y-axis.
Here is the output scatter plot diagram.
This was a quick start tutorial for Numpy and its implementations. To get in-depth knowledge of Python along with its various applications and real-time projects, you can enroll in Python Training in Chennai or Python Training in Bangalore by FITA or enroll for a Data science course in Chennai or Data science course in Bangalore which includes Supervised, Unsupervised machine learning algorithms, Data Analysis Manipulation and visualization, reinforcement testing, hypothesis testing and much more to make an industry required data scientist at an affordable price, which includes certification, support with career guidance assistance.