Imagine you’re a chef testing a new recipe to determine if it outperforms your classic dish. Hypothesis testing provides a structured, data-driven approach to making this decision, thereby avoiding reliance on subjective impressions.
Analysing sample data helps you identify whether the new recipe is preferred by most people (the population). In the real world applications, hypothesis testing is used to evaluate new medicines, assess the effectiveness of marketing campaigns, or improve manufacturing processes. This blog examines the definition, types, and applications of hypothesis testing, providing clear examples.Definition
Hypothesis testing is a statistical method used to determine if sample data provides enough evidence to support a claim about an entire population.It involves formulating two competing hypotheses:
- The null hypothesis (no effect or no difference)
- The alternative hypothesis (the claim to be tested)
By calculating a test statistic and a p-value, you assess whether the data supports rejecting the null hypothesis. This formal process ensures decisions are based on evidence, not chance. Indeed, hypothesis testing stands as one of the Essential Statistical Tools for Data-Driven Research, empowering analysts to draw reliable conclusions from complex datasets.
Future-proof your career with Selenium!
Master test automation and stand out in the industry.
Enroll NowTypes of hypothesis testing
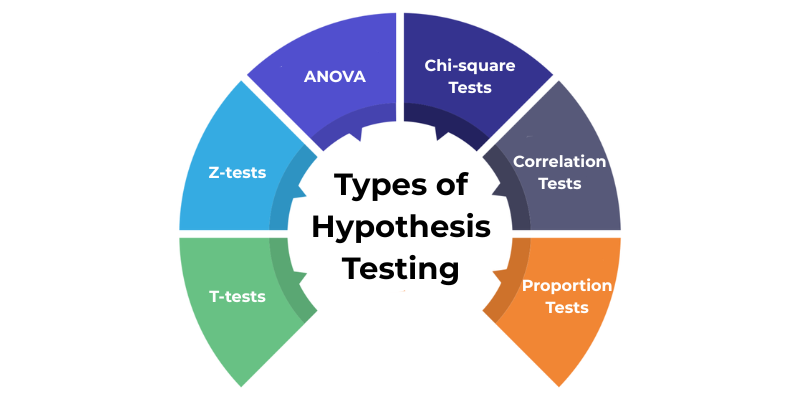
T-tests
T-tests are used to understand if the average value of something in one or more groups differs. T-tests are your go-to tool when dealing with averages and often have smaller sample sizes. There are 3 subtypes. They are:
One-sample T-test
Compares the mean of a single sample to a known or hypothesized population mean.
Example
A nutritionist believes the average calorie content of the particular brand of snack bar is 200 calories. They take a sample of bars, measure their calorie content, and use a one-sample t-test to see if the average calorie content of their sample significantly differs from 200.
Two-sampled T-test
Compares the means of two independent groups to see if they differ.
Example
A researcher is comparing the effectiveness of two different teaching methods on student test scores. They randomly assign students to two groups, teach them using the two methods, and then compare the mean test scores of these two groups using an independent sample t-test.
Paired T-test
Compares means from the same group under two conditions (e.g., before and after an intervention).
Example
A fitness trainer wants to know if a new exercise program helps people lose weight. They measure the weight of a group of individuals before they start the program and again after several weeks. A paired t-test is used to see if there’s a significant average weight loss.
T-tests in Data Science are fundamental tools used to understand if the average value of something in one or more groups differs. T-tests are your go-to when dealing with averages, especially with smaller sample sizes, and are frequently applied in various analytical problems.
Z-tests
Z-tests compare means when the population variance is known or the sample size is large (typically >30). These are tests for comparing averages. They are similar to t-tests but you usually need to know a normal distribution and known population (population standard deviation) parameters.
Example
Imagine a candy machine that’s supposed to dispense 50% red candies. You get a big bag and find only 45% red candies. A Z-test, knowing how the machine usually varies, helps you decide if your bag’s lower red percentage is just a random bad luck draw, or if the machine is actually dispensing fewer red candies than it should.
ANOVA (Analysis of Variance)
When you have more than two groups and want to see if there’s a significant difference in their average values, ANOVA is your tool. Instead of just comparing two averages, ANOVA can compare the averages of three, four, or even more groups simultaneously. It tells you if there’s any significant difference between the group averages.
ANOVA compares means across three or more groups to identify if at least one group’s mean differs significantly. If significant, post-hoc tests pinpoint which groups differ.Example
A marketing team wants to test the effectiveness of three different advertising campaigns. They run each campaign in different regions and then compare the average sales increase in each region using analysis of variance (ANOVA). If the ANOVA test shows a significant result, it means at least one of the campaigns led to a different average sales increase than the others. Further tests (post-hoc tests) would then be needed to determine which specific campaign outperforms.

Chi-square Tests
Chi-square tests are used when your data is in the form of counts or frequencies within different categories.
Example
Imagine you expect an equal number of red, blue, and green candies in a bag. You open a bag and count 10 red, 15 blue, and 5 green. A chi-square test helps you find if the number of each color you observed is significantly different from the equal numbers you expected, and it suggests the distribution might not be equal.
Correlation Tests
Correlation tests are used when you want to understand the linear relationship between two continuous (numerical) variables. These tests tell you how strongly two things are related and in what direction (as one goes up, does the other tend to go up or down?).
Example
Think about studying for a test. As the number of hours you study tends to go up, your test score often tends to go up as well. A correlation test helps measure how strong this tendency is if studying a lot really strongly relates to getting a high score, or if it’s just a weak connection. It tells you if they move together.
Proportion Tests
Proportion tests are used when you’re dealing with the proportion or percentage of successes in one or more groups.
Example
A company launches a new website design and wants to know if it’s more effective at getting people to sign up for their newsletter. They track sign-ups for a week with the old design and a week with the new design. A proportion test helps them see if the percentage of website visitors who signed up is significantly higher with the new design compared to the old one.
Hypothesis Testing in Data Science
Let us see how hypothesis testing is applied in data science today.
- Testing Changes (A/B Testing): To see if a new website design or feature actually improves things (like clicks or sign-ups) using proportion tests.
- Choosing Important Data (Feature Selection): Determine if a specific piece of information (like income) really affects what you’re trying to predict using t-tests or ANOVA.
- Finding Unusual Things (Anomaly Detection): To spot weird data points, like unusually large transactions, by checking if they stray far from the norm using tests like Z-tests.
- Checking How Good Models Are (Model Evaluation): To compare different ways of predicting things to see if one is truly better than another, using t-tests on errors.
- Understanding Data Patterns (Distribution Analysis): To see if your data follows a certain expected pattern (like a bell curve) using chi-square tests.
This is a fundamental practice in the field, and a dedicated Software Testing Course can teach you the frameworks of Software Testing and its different types to rigorously test applications for optimal performance.
Break into tech with Software Testing!
Master the skills to become an expert in quality assurance.
Enquire NowStatistical Hypothesis Testing
It is a formal way to check if evidence from a sample supports a claim about a larger group (population). It involves stating two opposing ideas: a “no change” idea (null hypothesis) and what you’re trying to prove (alternative hypothesis). You collect data, calculate a value (test statistic), and find the chance (p-value) of seeing such data if the “no change” idea were true. If this chance is low enough (below a set level), you reject the “no change” idea and conclude your claim is likely true.
Mastering these complex methodologies is what transforms individuals into the Stars of Software Testing, driving innovation and quality in the industry.
For example, testing if a new fertiliser increases crop yield involves comparing the yield of plants with the new fertiliser to those without, to see if the difference is statistically significant, not just random.
To conclude, this blog explains to you what hypothesis testing is and the various types of testing of hypothesis testing used in statistics, along with their types, with clear and practical examples. If you are interested in learning statistics and data science algorithms, a Data Science Course in Chennai can provide you with the comprehensive knowledge and practical skills necessary for your studies on big data analysis.
